Fig. 5.
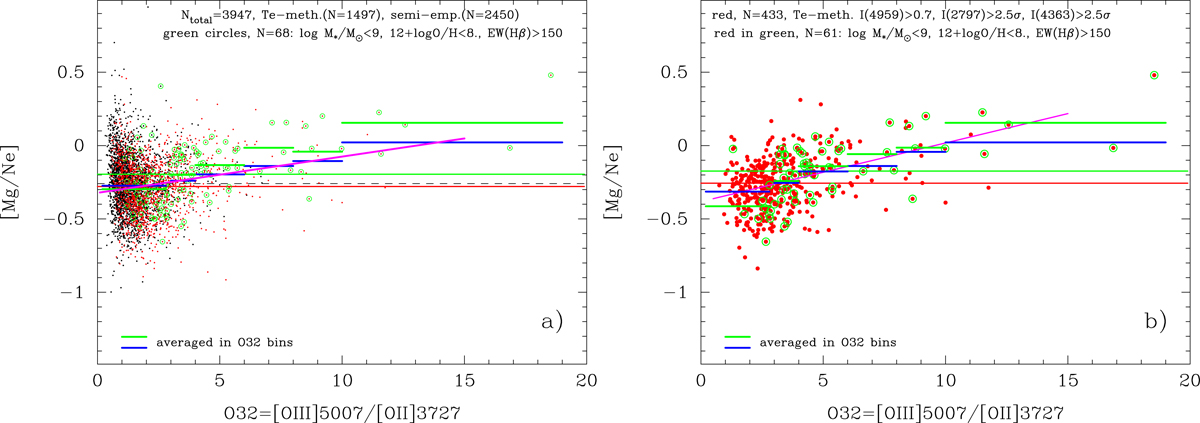
Panel a: [Mg/Ne] – O32 relations for all Mg II emitters depicted as in Fig. 1. The dots inside green circles represent low-metallicity (12 + log O/H < 8.0) low-mass (log(M⋆/M⊙) < 9.0) galaxies with high EW(Hβ) > 150 Å. Linear regression to all the galaxies is shown by a purple line and average values in bins of O32 are shown by blue lines for all galaxies and by green lines for galaxies of low metallicity, low mass, and high EW(Hβ). Panel b: same as in panel a, but only for galaxies with abundance determination by the direct Te method and accuracy better than 40% (more than 2.5σ) for weak but important Mg IIλ2797Å and [O III]λ4363Å emission lines. Galaxies with flux ratios I[O III]λ4959/I(Hβ) less than 0.7 were also excluded, resulting in a significantly reduced number of galaxies N = 433 (red dots). A linear regression to the Te data is shown by a purple line and average values in bins of O32 are represented by blue lines. As in panel a the galaxies with stellar masses log(M⋆/M⊙) < 9.0, oxygen abundances 12 + log O/H < 8.0, and EW(Hβ) > 150 Å are represented by dots inside green circles. Average values of these galaxies in O32 bins are shown by green lines. Long red and green horizontal lines are average values belonging to samples of corresponding colours.
Current usage metrics show cumulative count of Article Views (full-text article views including HTML views, PDF and ePub downloads, according to the available data) and Abstracts Views on Vision4Press platform.
Data correspond to usage on the plateform after 2015. The current usage metrics is available 48-96 hours after online publication and is updated daily on week days.
Initial download of the metrics may take a while.