Fig. 6.
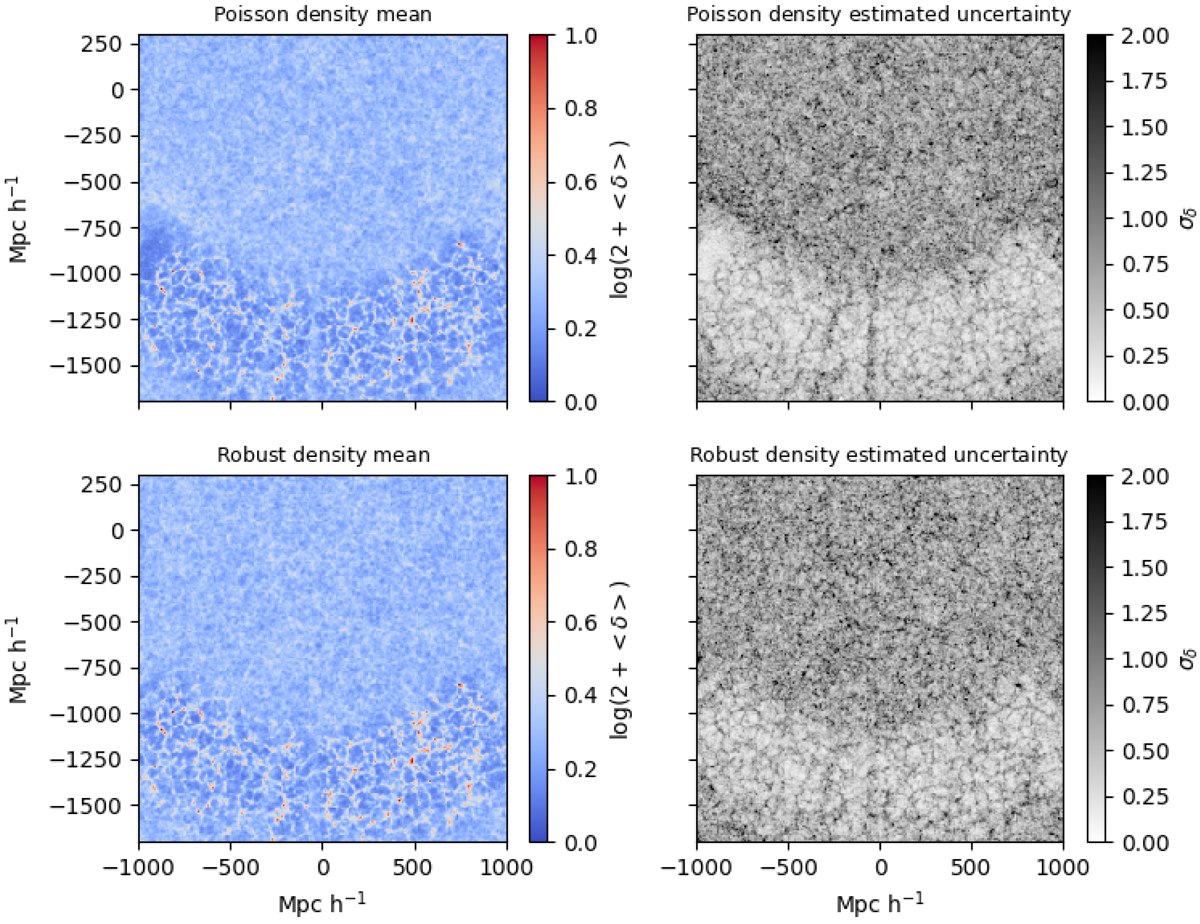
Mean and standard deviation of the inferred non-linearly evolved density fields, computed from the MCMC realizations, with the same slice through the 3D fields being depicted above for both the Poissonian (upper panels) and augmented (lower panels) likelihoods. The filamentary nature of the non-linearly evolved density field can be observed in the regions constrained by the data, with the unobserved or masked regions displaying larger uncertainty, as expected. Unlike our robust data model, the standard Poissonian analysis yields some artefacts in the reconstructed density field, particularly near the edges of the survey, where the foreground contamination is stronger.
Current usage metrics show cumulative count of Article Views (full-text article views including HTML views, PDF and ePub downloads, according to the available data) and Abstracts Views on Vision4Press platform.
Data correspond to usage on the plateform after 2015. The current usage metrics is available 48-96 hours after online publication and is updated daily on week days.
Initial download of the metrics may take a while.