Fig. 5.
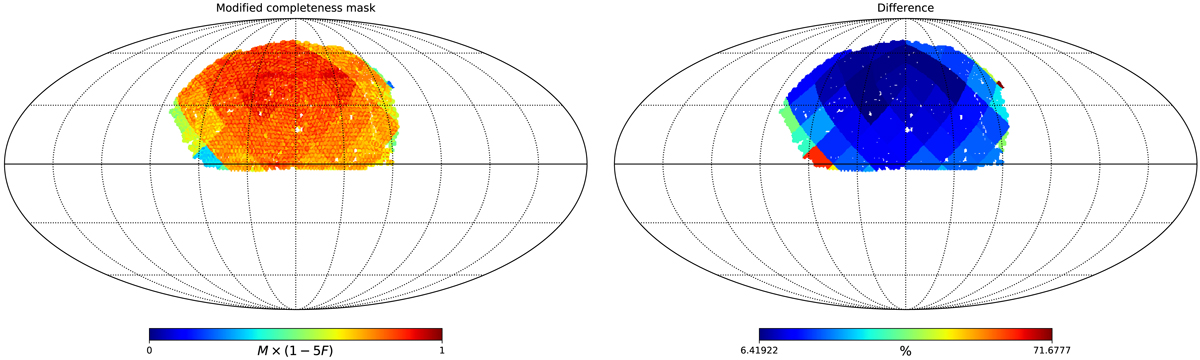
Contaminated completeness mask (left panel) and percentage difference compared to the original completeness mask (right panel). The contamination is introduced by multiplying the original mask by a factor of (1 − 5F) where F is a foreground template, in this case, the dust extinction map downgraded to the angular resolution of the colour indexing map depicted in Fig. 1. The factor α = 5 is chosen such that the mean contamination is 15%, an arbitrary choice to ensure that the contaminations are significant in the completeness mask. The difference between the original and contaminated masks shows that the effect is stronger on the edges of the survey.
Current usage metrics show cumulative count of Article Views (full-text article views including HTML views, PDF and ePub downloads, according to the available data) and Abstracts Views on Vision4Press platform.
Data correspond to usage on the plateform after 2015. The current usage metrics is available 48-96 hours after online publication and is updated daily on week days.
Initial download of the metrics may take a while.