Fig. 6.
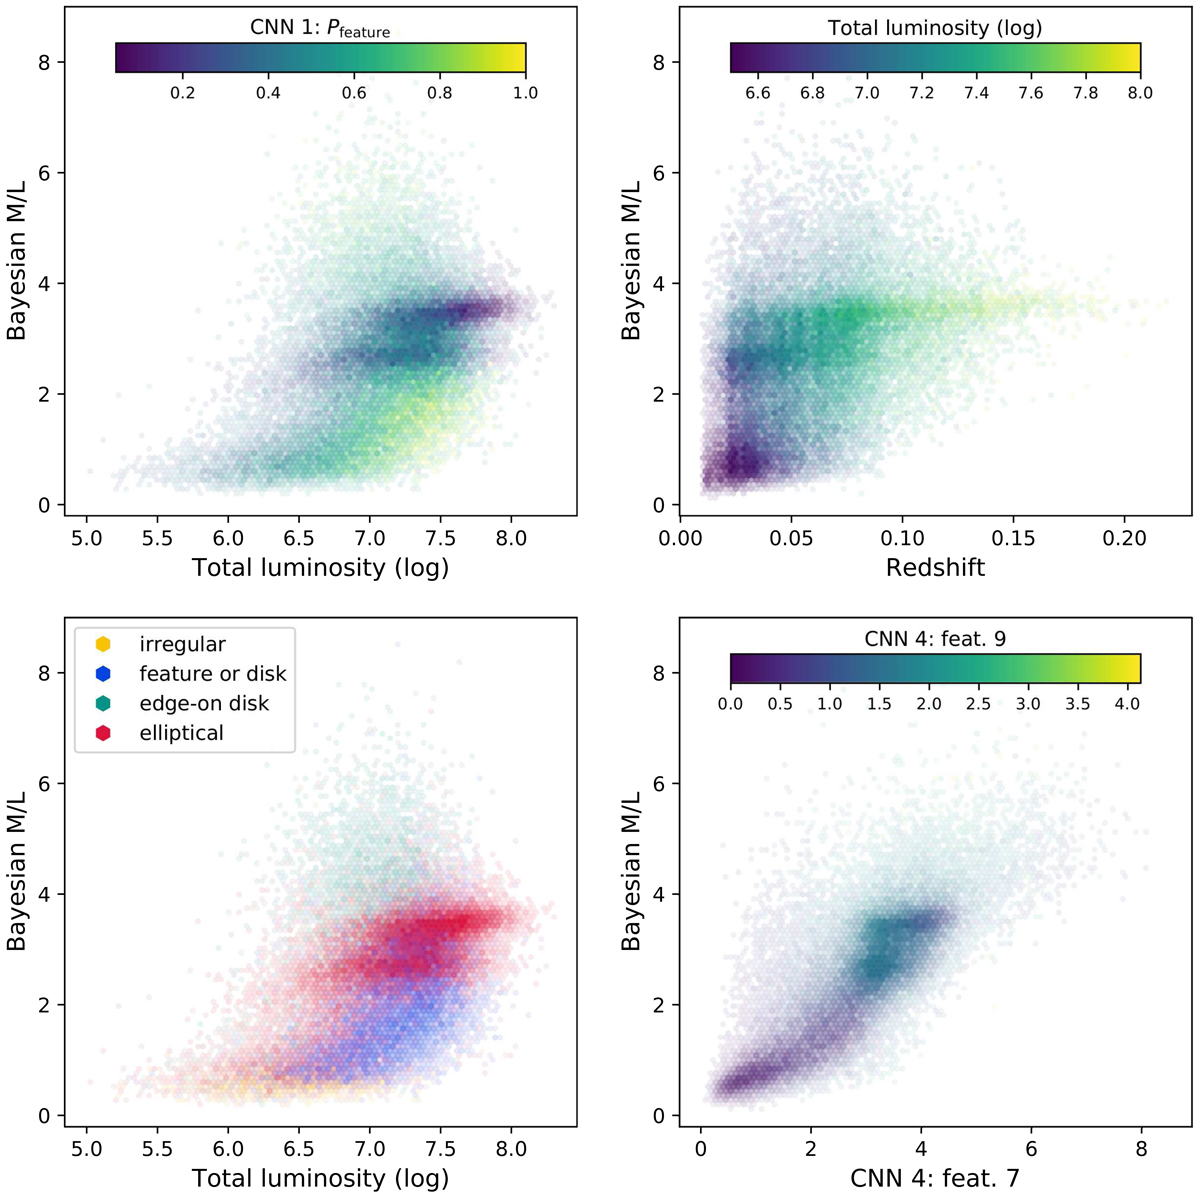
Influence of a few features on M/L, for the training set. Due to the large number of datapoints, we use (hexagonal) bins. The opacity of each bin corresponds to the number of galaxies in the bin, in a non-linear way (ensuring that lower densities are still visible). The total luminosity denotes the total g-band luminosity in L⊙, g, and is shown in log space. For the top left panel, the Pfeature feature from CNN 1 estimates the GZ2 probability of the galaxy having a feature or disk. For the bottom left panel, the morphology is determined from the last layer of CNN 1. A galaxy is defined as irregular if the predicted probability of being irregular is larger than 20%, it is considered edge-on if it is not irregular but has a probability of being edge-on larger than 40%, and it is a feature or disk if the corresponding probability is larger than 40% (but it is not in the previous two categories). The ellipticals are the remaining datapoints.
Current usage metrics show cumulative count of Article Views (full-text article views including HTML views, PDF and ePub downloads, according to the available data) and Abstracts Views on Vision4Press platform.
Data correspond to usage on the plateform after 2015. The current usage metrics is available 48-96 hours after online publication and is updated daily on week days.
Initial download of the metrics may take a while.