Fig. 4.
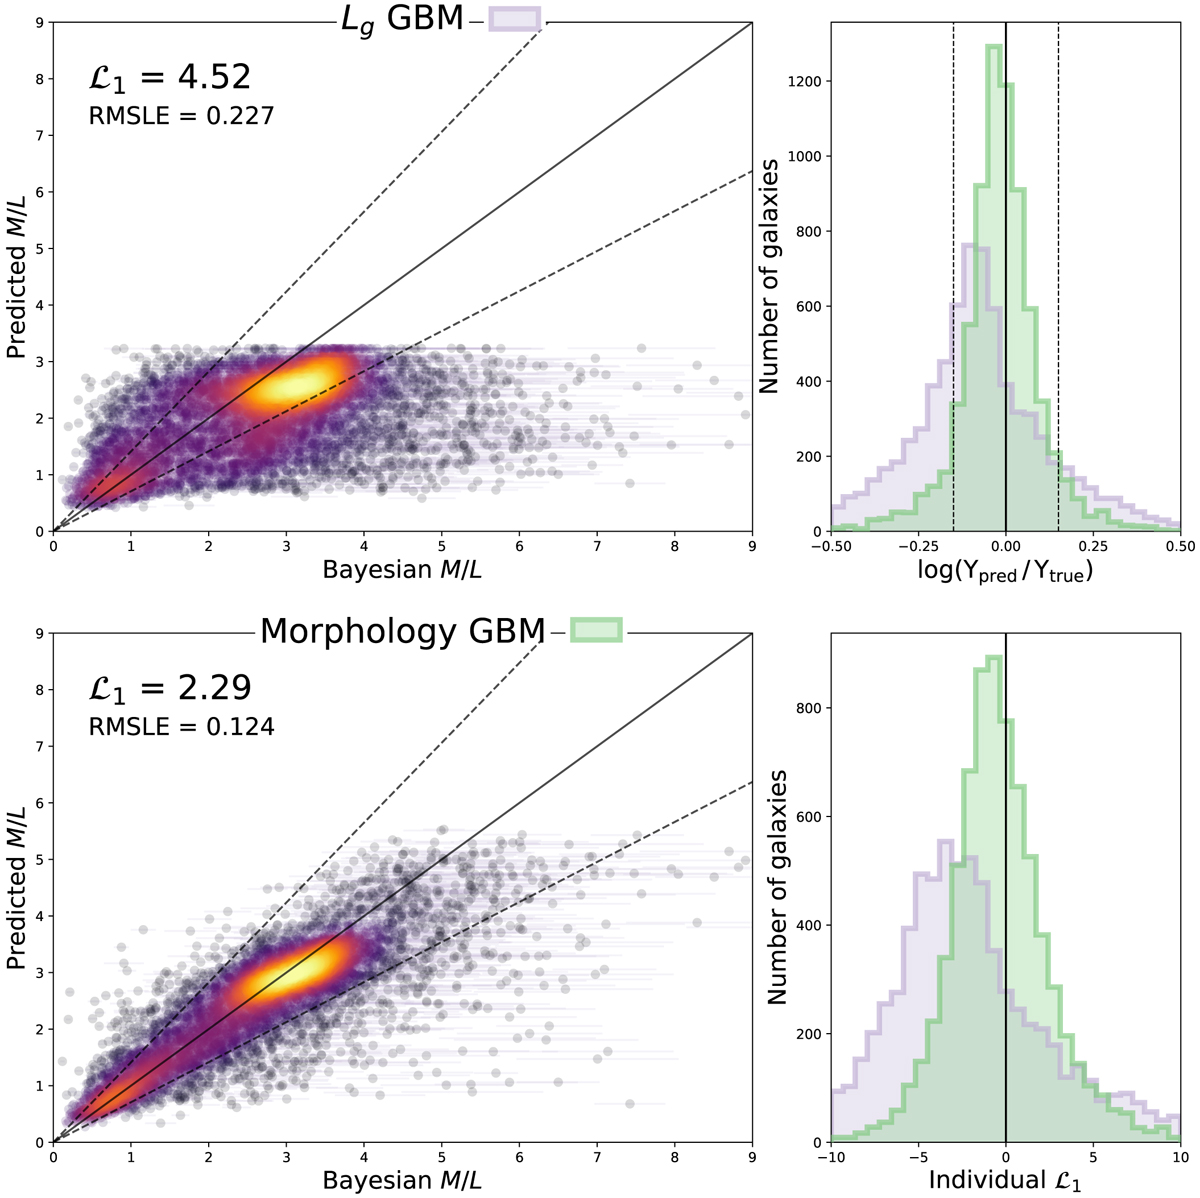
Left: comparing the predicted M/L to the true M/L for a gradient boosting machine without morphology (top) and with morphology (bottom). Both predictors only make use of the g-band. The colour of the points is a 2D gaussian kernel density estimate. Right: histogram of dex error (top) and ℒ1 (bottom) for each galaxy. Purple is used for the predictor without morphology, while green is used for the predictor that includes morphology. For both quantities, closer to zero is better, positive numbers denote overpredictions, and negative values are underpredictions. The figure only includes galaxies from the test set. The dashed lines show 0.15 dex errors.
Current usage metrics show cumulative count of Article Views (full-text article views including HTML views, PDF and ePub downloads, according to the available data) and Abstracts Views on Vision4Press platform.
Data correspond to usage on the plateform after 2015. The current usage metrics is available 48-96 hours after online publication and is updated daily on week days.
Initial download of the metrics may take a while.