Fig. 3.
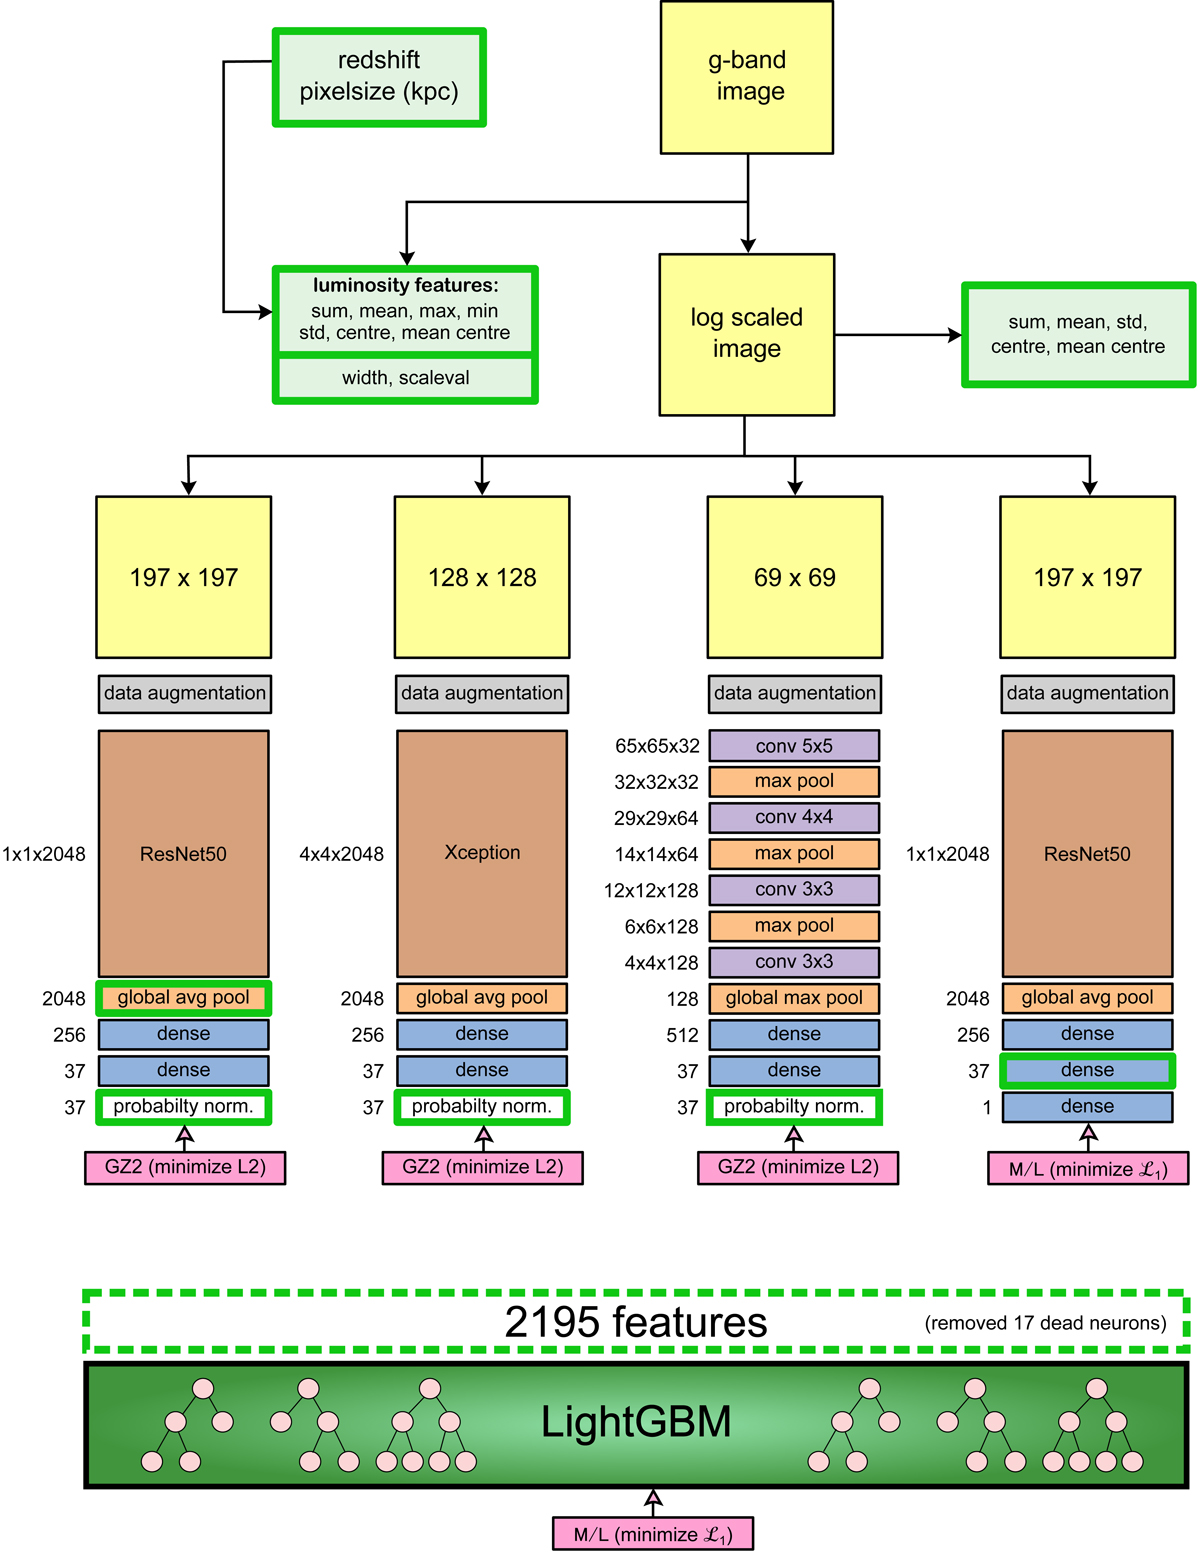
Schematic overview of the machine learning pipeline. The black arrows denote the order in which properties are derived from each other. The pink boxes show the optimization objective: three CNNs are optimizing the Galaxy Zoo 2 probabilities, using a mean squared error (L2) loss. The LightGBM and the fourth CNN optimize M/L according to a ℒ1 loss. The initial weights of this last CNN were set to the final values of the first CNN (pretraining). The boxes with the bright green outline were used as features for the LightGBM, after disregarding the ones that always were zero (dead neurons). For each of the neural layers or blocks, the output dimension is provided on the left.
Current usage metrics show cumulative count of Article Views (full-text article views including HTML views, PDF and ePub downloads, according to the available data) and Abstracts Views on Vision4Press platform.
Data correspond to usage on the plateform after 2015. The current usage metrics is available 48-96 hours after online publication and is updated daily on week days.
Initial download of the metrics may take a while.