Fig. 2.
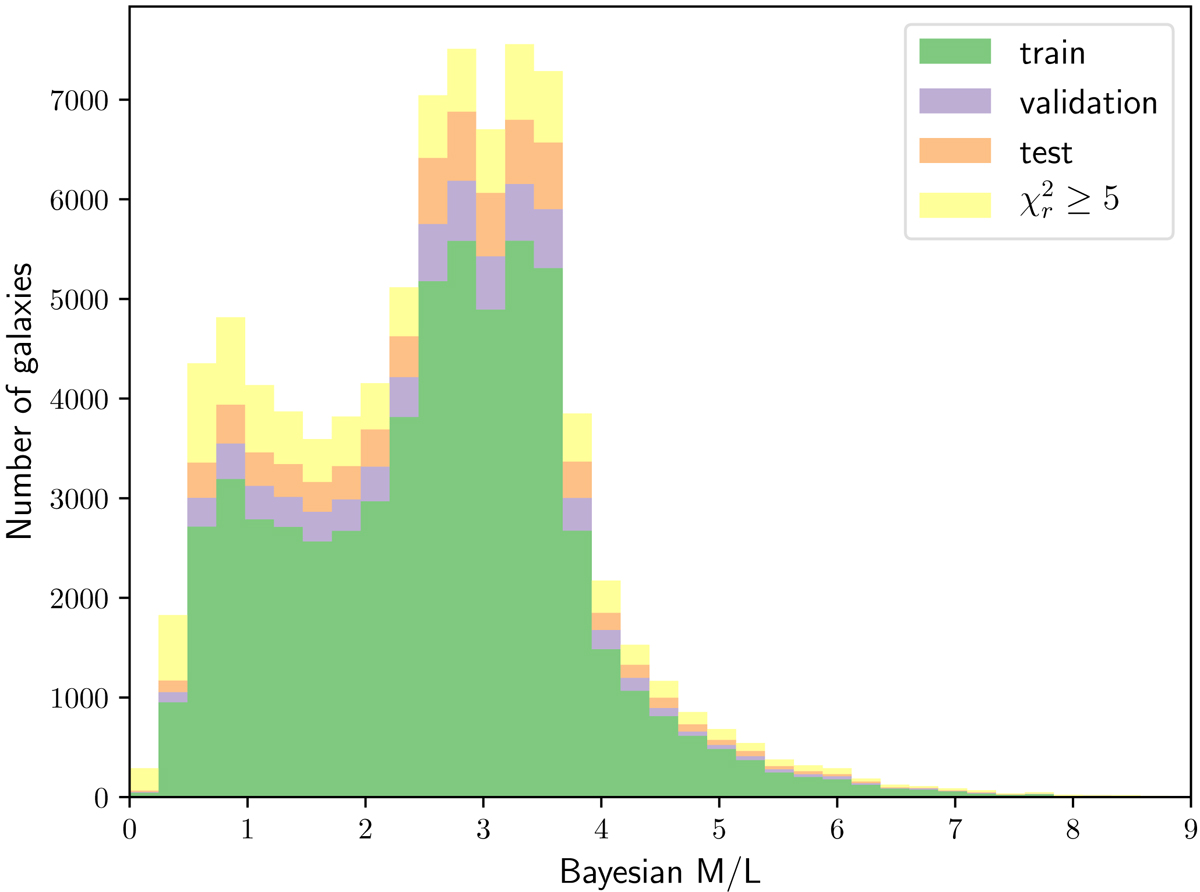
Histogram of the M/L values from GSWLC 2, after applying the threshold D25 > 0.4 arcmin. The galaxies with ![]() were not used for the machine learning. From the remaining galaxies, 59 637 were used for training, 6627 for validation and 7363 galaxies for testing, as described in Sect. 2.3. These samples were randomly drawn, and hence their distribution is similar.
were not used for the machine learning. From the remaining galaxies, 59 637 were used for training, 6627 for validation and 7363 galaxies for testing, as described in Sect. 2.3. These samples were randomly drawn, and hence their distribution is similar.
Current usage metrics show cumulative count of Article Views (full-text article views including HTML views, PDF and ePub downloads, according to the available data) and Abstracts Views on Vision4Press platform.
Data correspond to usage on the plateform after 2015. The current usage metrics is available 48-96 hours after online publication and is updated daily on week days.
Initial download of the metrics may take a while.