Fig. 8
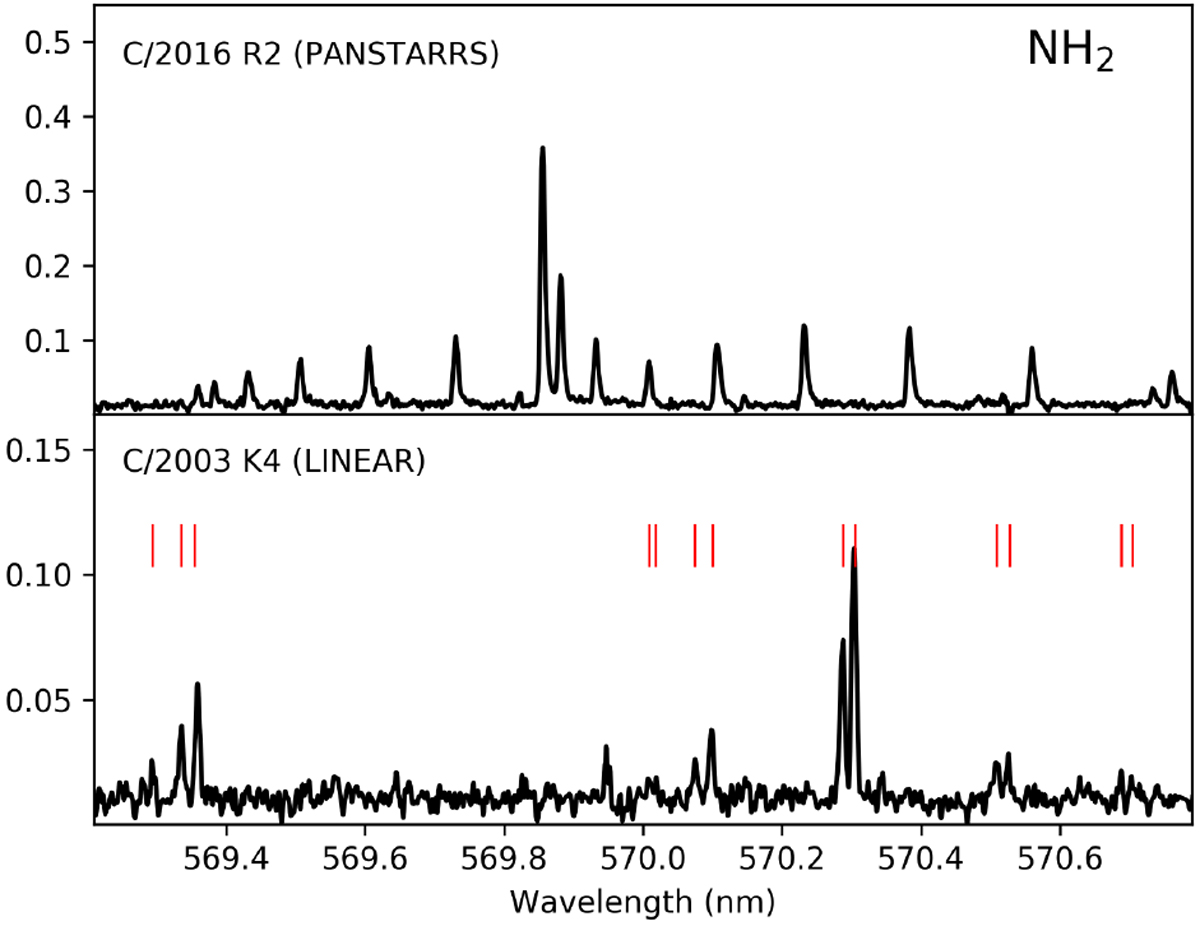
Comparison of the UVES spectra of comets C/2016 R2 at 2.8 au and C/2003 K4 at 2.6 au over the 569.3 to 570.8 nm wavelength range, showing the detection of NH2 lines in K4 (indicated by the vertical red lines, those lines belong to the A(0,10,0)–X(0,0,0) band) and their non-detection in R2. The y-axis has arbitrary units and has been chosen to display both spectra on a similar scale. Most lines detected in R2 in this wavelength range belong to the CO+ (1,2) band.
Current usage metrics show cumulative count of Article Views (full-text article views including HTML views, PDF and ePub downloads, according to the available data) and Abstracts Views on Vision4Press platform.
Data correspond to usage on the plateform after 2015. The current usage metrics is available 48-96 hours after online publication and is updated daily on week days.
Initial download of the metrics may take a while.