Fig. 5.
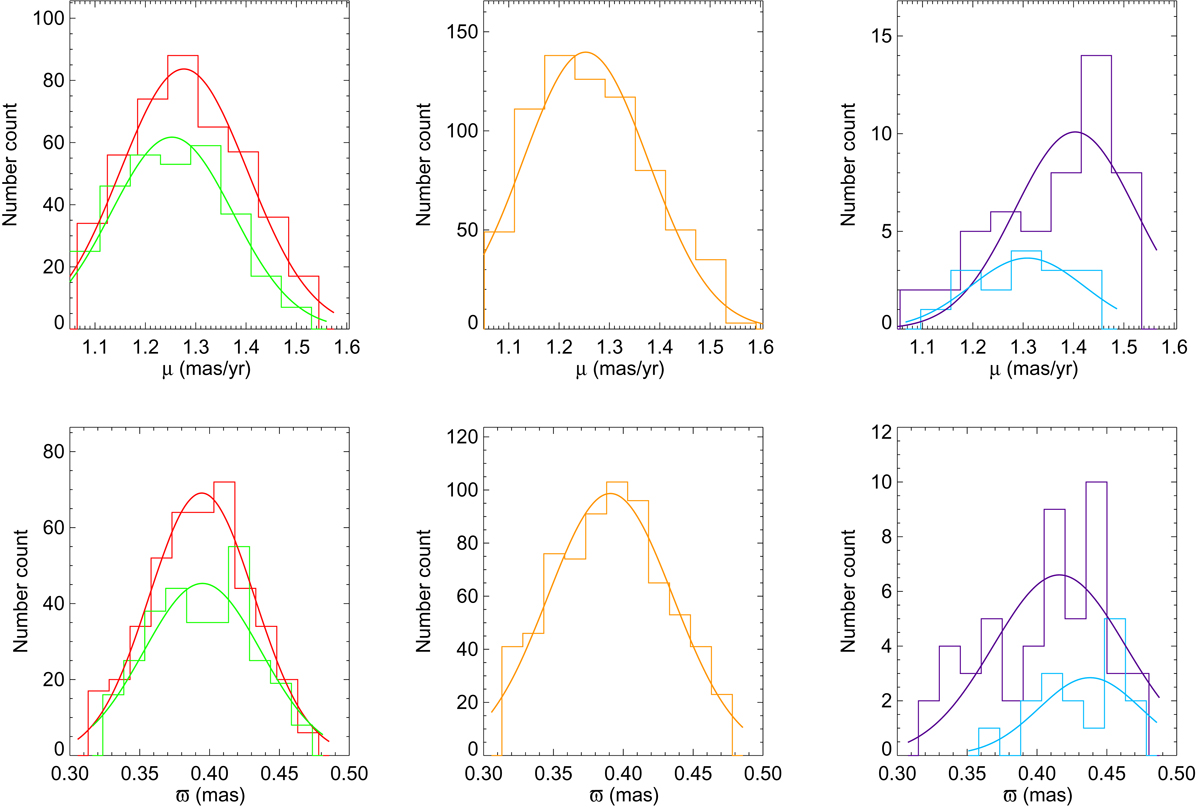
Proper motion and parallax distribution of each component identified by the DBSCAN. Colored lines indicate Double Cluster components, including h Persei (red), χ Persei (green), the halo population (yellow), S1 (blue), and S2 (violet). A Gaussian function is also applied to fit the histogram of each component. The fitted results are shown in Table 1.
Current usage metrics show cumulative count of Article Views (full-text article views including HTML views, PDF and ePub downloads, according to the available data) and Abstracts Views on Vision4Press platform.
Data correspond to usage on the plateform after 2015. The current usage metrics is available 48-96 hours after online publication and is updated daily on week days.
Initial download of the metrics may take a while.