Fig. 4.
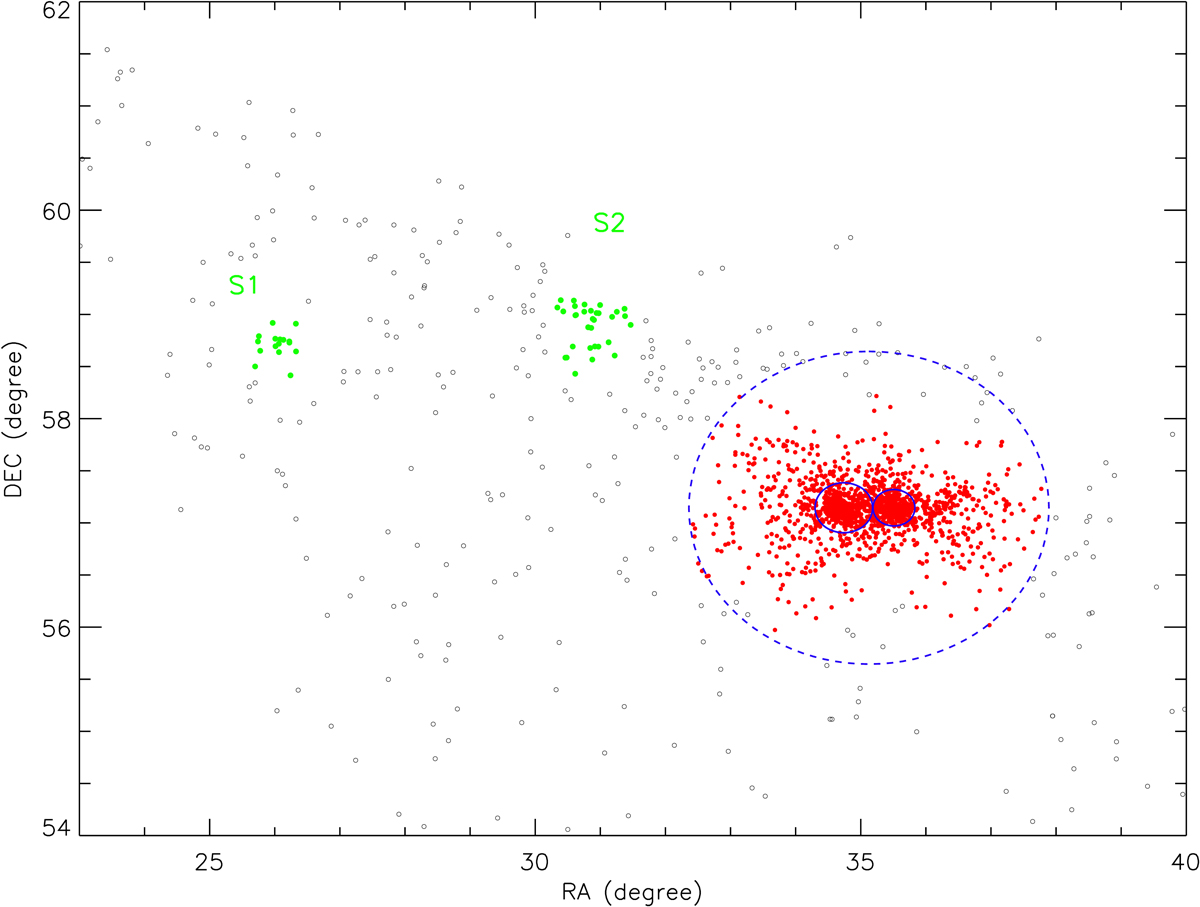
Spatial distribution of member candidates selected using the membership criteria. Based on the classification results from the DBSCAN clustering algorithm, substructure components; halo and core components are indicated as green and red dots, respectively. The solid line represents the core region from Kharchenko et al. (2013). For comparison, the extended halo region in this work is plotted with the dashed curve; 1.5° in radius are centered the Double Cluster centre, which is about 6 − 8 times larger than the core radius of the Double Cluster.
Current usage metrics show cumulative count of Article Views (full-text article views including HTML views, PDF and ePub downloads, according to the available data) and Abstracts Views on Vision4Press platform.
Data correspond to usage on the plateform after 2015. The current usage metrics is available 48-96 hours after online publication and is updated daily on week days.
Initial download of the metrics may take a while.