Fig. 1.
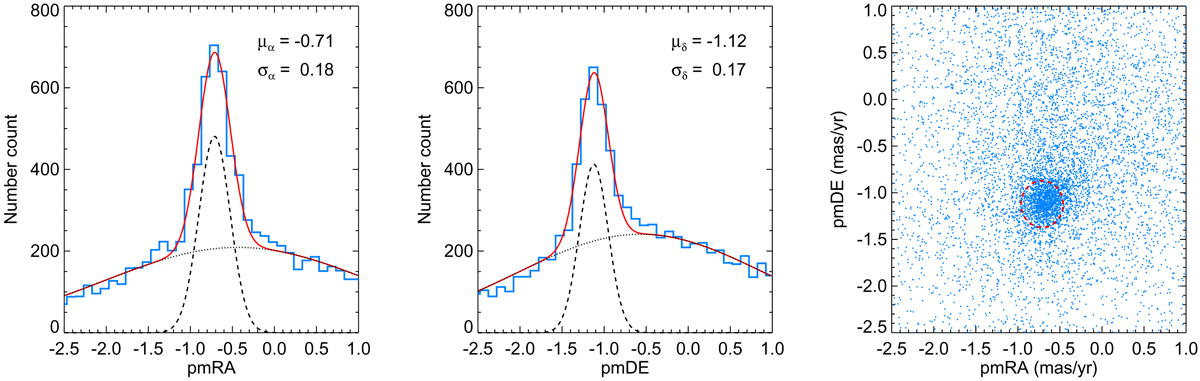
Proper motion distribution of member candidates in the core regions (< 10′ from the centers of h and χ Persei). The proper motion distribution in RA and Dec are shown in the left panel and central panel. Double Gaussian profiles fit the distribution of members (dashed curve) and field stars (dotted curve) separately, while the solid red line shows the combined profiles. Right panel: the red dashed line represents the membership criteria in the proper motion space, which includes the most probable member stars.
Current usage metrics show cumulative count of Article Views (full-text article views including HTML views, PDF and ePub downloads, according to the available data) and Abstracts Views on Vision4Press platform.
Data correspond to usage on the plateform after 2015. The current usage metrics is available 48-96 hours after online publication and is updated daily on week days.
Initial download of the metrics may take a while.