| Issue |
A&A
Volume 624, April 2019
LOFAR Surveys: a new window on the Universe
|
|
|---|---|---|
| Article Number | C1 | |
| Number of page(s) | 1 | |
| Section | Cosmology (including clusters of galaxies) | |
| DOI | https://doi.org/10.1051/0004-6361/201833900e | |
| Published online | 02 April 2019 | |
Radio observations of the merging galaxy cluster Abell 520 (Corrigendum)
1
Leiden Observatory, Leiden University, PO Box 9513, 2300 RA Leiden, The Netherlands
e-mail: This email address is being protected from spambots. You need JavaScript enabled to view it.
2
Netherlands Institute for Radio Astronomy (ASTRON), PO Box 2, 7990 AA Dwingeloo, The Netherlands
3
INAF-Istituto di Radioastronomia, Via P. Gobetti 101, 40129 Bologna, Italy
4
Harvard-Smithsonian for Astrophysics, 60 Garden Street, Cambridge, MA 02138, USA
5
Dipartimento di Fisica e Astronomia, Università di Bologna, Via P. Gobetti 93/2, 40129 Bologna, Italy
6
Hamburger Sternwarte, University of Hamburg, Gojenbergsweg 112, 21029 Hamburg, Germany
7
Thüringer Landessternwarte, Sternwarte 5, 07778 Tautenburg, Germany
8
Indian Institute of Science Education and Research (IISER), Pune, India
9
European Southern Observatory, Karl-Schwarzschild-Str. 2, 85748 Garching, Germany
Key words: acceleration of particles / galaxies: clusters: individual: Abell 520 / galaxies: clusters: intracluster medium / large-scale structure of Universe / errata, addenda
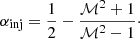
Some errors have occurred during the production of the original article. The left panel of Fig. 8 was incomplete. Here we publish the correct Fig. 8. Also, Eq. (5) was incorrect, it should read:
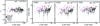 |
Fig. 8. Scatter plots of spectral index and radio SB (IR) as a function of X-ray SB (IX). The regions for extracting data are shown in the overlaid image (left panel). The data points are plotted in the same colour as the regions in the overlaid image (i.e. black circles for the central regions, magenta squares for the regions in the SW direction, and red diamonds for the regions in the NE direction). The best-fit parameters are obtained for the central regions. |
© ESO 2019
All Figures
|
Fig. 8. Scatter plots of spectral index and radio SB (IR) as a function of X-ray SB (IX). The regions for extracting data are shown in the overlaid image (left panel). The data points are plotted in the same colour as the regions in the overlaid image (i.e. black circles for the central regions, magenta squares for the regions in the SW direction, and red diamonds for the regions in the NE direction). The best-fit parameters are obtained for the central regions. |
| In the text | |
Current usage metrics show cumulative count of Article Views (full-text article views including HTML views, PDF and ePub downloads, according to the available data) and Abstracts Views on Vision4Press platform.
Data correspond to usage on the plateform after 2015. The current usage metrics is available 48-96 hours after online publication and is updated daily on week days.
Initial download of the metrics may take a while.