Fig. 8.
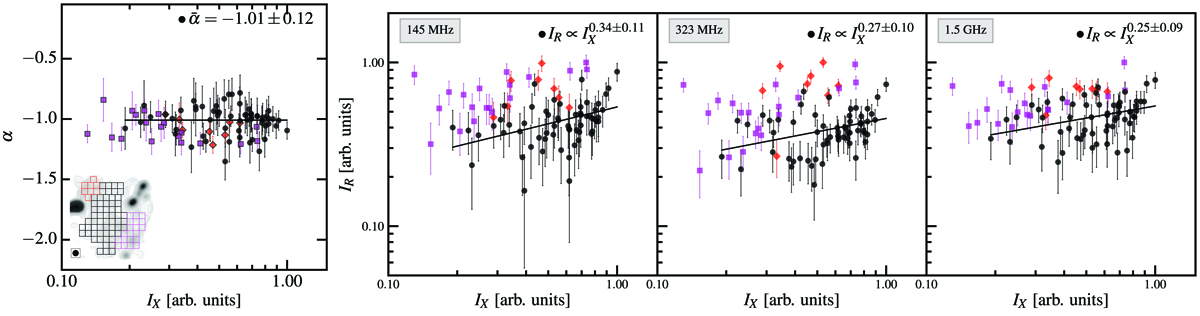
Scatter plots of spectral index and radio SB (IR) as a function of X-ray SB (IX). The regions for extracting data are shown in the overlaid image (left panel). The data points are plotted in the same colour as the regions in the overlaid image (i.e. black circles for the central regions, magenta squares for the regions in the SW direction, and red diamonds for the regions in the NE direction). The best-fit parameters are obtained for the central regions.
Current usage metrics show cumulative count of Article Views (full-text article views including HTML views, PDF and ePub downloads, according to the available data) and Abstracts Views on Vision4Press platform.
Data correspond to usage on the plateform after 2015. The current usage metrics is available 48-96 hours after online publication and is updated daily on week days.
Initial download of the metrics may take a while.