| Issue |
A&A
Volume 624, April 2019
|
|
|---|---|---|
| Article Number | A14 | |
| Number of page(s) | 10 | |
| Section | Atomic, molecular, and nuclear data | |
| DOI | https://doi.org/10.1051/0004-6361/201833762 | |
| Published online | 01 April 2019 | |
Electron-impact ionization of Fe8+
Institute of Theoretical Physics and Astronomy, Vilnius University, Saulėtekio av. 3, 10257 Vilnius, Lithuania
e-mail: ausra.kyniene@tfai.vu.lt
Received:
3
July
2018
Accepted:
29
January
2019
Electron-impact ionization cross sections and Maxwellian rate coefficients are presented for the Fe8+ ion by considering processes from the ground and metastable levels. The lifetimes of the levels for the 3s2 3p5 3d configuration were analysed using the extended basis of interacting configurations. Convergence of the cross sections for the indirect process due to excitations to the high-nl subshells was investigated. We demonstrate that excitations to the subshells with orbital quantum number l = 3 with subsequent autoionization dominate up to electron energies of ∼700 eV for the ground and metastable levels. Modelling of theoretical cross sections obtained for the ground and metastable levels to produce the best fit to the measurements shows that 15% of ions reach the reaction zone in the metastable state. The obtained results contradict the previous work that showed ∼30% for the metastable fraction.
Key words: atomic processes / atomic data
© ESO 2019
1. Introduction
Spectroscopic data provided by the Chandra, XMM-Newton, Solar and Heliospheric Observatory (SOHO), and Hinode satellites opened new opportunities to study astrophysical objects. Iron ions play an important role in the diagnostics of stellar coronae since the corresponding spectra are rich in strong lines (Gabriel et al. 1966; Phillips et al. 2012; Beiersdorfer et al. 2014) and it is an abundant element in the Universe. The Iron project was initiated to compute electron-impact excitation cross sections and rates as well as radiative transition probabilities and photoionization cross sections for the iron ions important in astrophysical applications (Hummer et al. 1993). However, charge state distribution of plasma has to be known since the emission line intensities depend on the ion concentration. Electron-impact ionization and electron-ion recombination define charge state distribution in the collisionally ionized plasmas.
First measurements of the electron-impact ionization cross sections for iron were started by analysing the Fe+ ions (Montague et al. 1984). The crossed beams technique was used in the study. Later, this approach was applied to analyse the Fe2+ ion (Mueller et al. 1985). The Lotz formula (Lotz 1968) and the distorted wave (DW) calculations produced good agreement with experimental data. Excitation followed by autoionization (EA) with radiative damping in addition to the direct ionization (DI) were calculated for Fe23+ by Butler & Moores (1985). They demonstrated that the radiative decay of the excited autoionizing states diminishes the EA cross sections by approximately 20%. In the same way, the Fe5+, Fe6+, and Fe7+ were analysed by Gregory et al. (1986). The cross sections for Fe5+, Fe6+, Fe9+, Fe11+, and Fe13+ were calculated by applying the configuration-average DW (CADW) method by Pindzola et al. (1986). They provided values for the DI and EA processes that explained previous disagreements with measurements (Gregory et al. 1986). The calculations for the electron-impact ionization cross sections and plasma rate coefficients were extended for the iron isonuclear sequence (Pindzola et al. 1987). The experimental atomic data of the ionization for Fe11+, Fe13+, and Fe15+ ions were also reported (Gregory et al. 1987). Atomic iron was experimentally analysed using the crossed-electron-beam – fast-atom-beam method where charge-transfer neutralization was employed to prepare neutral atoms (Freund et al. 1990). The cross section for the lithium-like iron was measured at 4.66 keV using an electron-beam ion trap (Wong et al. 1993). Ion storage ring measurements for the Fe15+ ion (Linkemann et al. 1995) demonstrated the higher quality data compared to the previous crossed beams technique. Later, the electron-impact single ionization cross sections for Feq+ (q = 1 − 6, 9, 10) were measured by employing the animated crossed beams technique (Stenke et al. 1999). The DI and EA cross sections using the flexible atomic code (FAC; Gu 2008) were calculated for all iron ions (Dere 2007). Also, the FAC was used to calculate the electron-impact ionization cross sections for Fe11+ (Kwon & Savin 2012). Authors managed to improve previous results for this ion (Dere 2007). The Heidelberg heavy-ion storage test storage ring (TSR) was employed to obtain experimental cross sections for Fe11+ (Hahn et al. 2011). The approach used allowed for a significant reduction in the fraction of metastable ions in the beam. Therefore, the measurements were extended to other iron ions, such as Fe12+ (Hahn et al. 2011), Fe9+, Fe10+ (Hahn et al. 2012), Fe13+, Fe16+, Fe17+ (Hahn et al. 2013), Fe14+ (Bernhardt et al. 2014), Fe7+ (Hahn et al. 2015), and Fe8+ (Hahn et al. 2016). Recently, the cross sections for Fe1+, Fe2+, Fe3+, and Fe4+ ions were produced using the CADW method (Pindzola & Loch 2018).
It should be noted that experimental cross sections of electron-impact ionization process for the Fe8+ ion were only recently obtained using the heavy-ion storage TSR (Hahn et al. 2016) since previous measurements were not able to deal with large fractions of metastable ions in the beam. Detailed analysis of populations of the levels over time using the Boltzmann distribution for the initial population demonstrated that the 3s2 3p53d 3F4 level has the largest population, which amounts to about 57% during the data collection period (Hahn et al. 2016). However, fitting of theoretical data to the experimental cross sections provided value of ∼30% for the metastable fraction. The obtained disagreement suggests that the electron-impact ionization process for Fe8+ has to be investigated using other approaches.
The aim of the current paper is a study of electron-impact single ionization of the Fe8+ ion by performing level-to-level DW (LLDW) calculations. The previous CADW calculations for the ground level of Fe8+ considered DI from all subshells with n = 3 and EA for the 3s → nl (n ≼ 10) excitations (Hahn et al. 2016). For the metastable level, the 3s → 4l transitions contributing to the EA process were used from the previous work (Pindzola et al. 1987). On the other hand, our study takes into account the excitations from the 2s, 2p, 3s, and 3p subshells for the metastable level. The convergence of the EA cross sections is ensured by considering excitations up to subshells with the principal quantum number n = 20 and orbital quantum number l = 5. The obtained data for the ground and metastable levels are fitted to experimental values to determine the fraction of the metastable ions in the beam.
The rest of the paper is organized as follows. Section 2 presents a brief outline of the theoretical approach. In Sect. 3, the obtained results are discussed. Finally, we end with the conclusions from the present investigation.
2. Theoretical approach
The FAC (Gu 2008) is employed to generate energy levels, radiative and Auger transition probabilities, electron-impact excitation, and ionization cross sections for the Fe8+ ion. The code implements the Dirac-Fock-Slater approach. Single configuration approximation is used in the study of ionization cross sections. Therefore, the mixing of configuration state functions corresponding to the same configuration is taken into account. The local central potentials for the ground configurations of every ion are used to generate the necessary bound and continuum wavefunctions for each ion.
Ionization cross sections are studied for the ground and excited 3s2 3p5 3d 3F4 levels of the Fe8+ ion. The contribution from the excited level to the total electron-impact ionization cross sections is determined by fitting to experimental values. In addition, the change of the population levels over time is investigated by taking the initial population from the Boltzmann distribution for temperature kBTe = 87 eV (Hahn et al. 2016). The relative population pi for the level i is determined from the equation
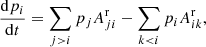
where  is the radiative decay from the level j to the level i. The first term on the right hand side defines transitions to the level i from the higher levels while the second term corresponds to the decay from the level i to the lower lying ones. Electric dipole and quadrupole as well as magnetic dipole transitions are calculated for all levels. Electric octupole and magnetic quadrupole transitions are included only for the lowest configurations: 3s23p6, 3s23p53d, 3s23p54s, 3s 3p63d, 3s23p43d2.
The radiative transition probabilities from the excited levels have to be known since radiative decays define which levels can contribute to experimental ionization cross sections. The lifetimes of the levels corresponding to the 3s2 3p5 3d configuration are analysed using the configuration interaction (CI) method. The bases of admixed configurations are generated by employing the configuration interaction strength (CIS; Kučas et al. 1997; Jonauskas et al. 2008, 2011; Karazija & Kučas 2013):
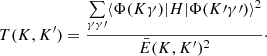
Here, g(K) is the statistical weight of the studied configuration K (3s2 3p5 3d) and  ) is the average energy distance between the energy levels of the configurations K and K′,
![$$ \begin{aligned} \bar{E}(K,K\prime )&=\frac{\mathop \sum \limits _{\gamma \gamma \prime } \left[ \langle \Phi (K\gamma ) \vert H \vert \Phi (K\gamma )\rangle \right. \left. - \langle \Phi (K\prime \gamma \prime ) \vert H \vert \Phi ( K\prime \gamma \prime )\rangle \right] }{\mathop \sum \limits _{\gamma \gamma \prime } \langle \Phi (K\gamma ) \vert H \vert \Phi (K\prime \gamma \prime )\rangle ^2} \nonumber \\ &\quad \times \langle \Phi (K\gamma ) \vert H \vert \Phi (K\prime \gamma \prime )\rangle ^2 . \end{aligned} $$](/articles/aa/full_html/2019/04/aa33762-18/aa33762-18-eq5.gif)
The summation in Eq. (2) is performed over all states γ and γ′ of the configurations K and K′, respectively. The T(K, K′)/g(K) is the average weight of the admixed configuration K′ in the expansion of the wave functions for K. A single-configuration pseudo-relativistic method (Cowan 1981) is then applied to obtain radial orbitals for the corresponding configurations. The ⟨Φ(Kγ)|H|Φ(K′γ′)⟩ is the interconfiguration matrix element of the pseudo-relativistic Hartree–Fock Hamiltonian H (Cowan 1981). Previously, the same approach was succesfully applied to study energy levels (Radžiūtė et al. 2015), electric dipole (Kynienė et al. 2008) and magnetic (Jonauskas et al. 2010, 2012) transitions, and Auger cascades (Jonauskas et al. 2008, 2011; Palaudoux et al. 2010).
Single and double excitations from the considered configurations are studied to build the list of admixed configurations. The single excitations from the 2s, 2p, 3s, 3p, and 3d subshells up to subshells with n = 7 and l = 5 (l < n) are investigated in this work. However, promotion of electrons up to the subshells with n = 5 and l = 4 are considered for double excitations. The CIS values are calculated for all the produced configurations.
Direct and indirect processes have to be considered for the analysis of electron-impact single ionization from the level i of Fe8+ to the level f of Fe9+:
Here, ε is the incident electron energy,  represents the DI cross section, and
  corresponds to the electron-impact excitation cross section to the level k of the Fe8+ ion. The summation over all final levels f of Fe9+ in Eq. (3) produces the total single ionization cross sections for the level i. Electron-impact excitation and DI cross sections are studied using the DW approximation.
The radiative damping of the excited autoionizing levels of Fe8+ is included in the study by calculating the autoionization branching ratio which is determined by the expression
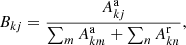
where Aa and Ar are the Auger and radiative transition probabilities, respectively.
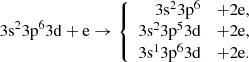
For the ground configuration, DI includes ionization of the 3s and 3p subshells:
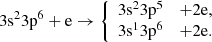
The EA channels are investigated for the following excitations from the ground configuration,
where n ≼ 20 and l ≼ 6. Therefore, 456 excited configurations are produced for which radiative and Auger decay processes are investigated. It should be noted that the excitations from the outermost subshell are not included in the study as the corresponding excited states are not autoionizing.
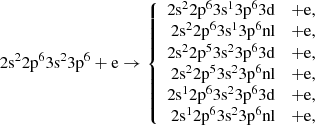
For the 3s2 3p5 3d configuration, DI is analysed for the 3s, 3p, and 3d subshells:
The following excitations are studied to obtain the EA cross-sections:
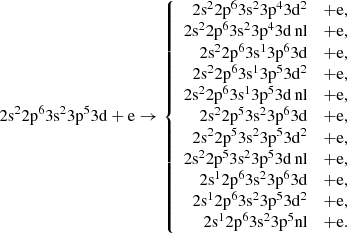
This leads to 544 configurations.
The resonant excitation double autoionization (REDA) process is not considered in this study. The contribution from the REDA process is much smaller compared to DI and EA.
Electron-impact ionization cross sections σij(ε) are used to calculate the Maxwellian rate coefficients
for the Maxwellian–Boltzmann electron energy distribution at electron temperature Te. Here, kB is the Boltzmann constant and me is the electron mass.
3. Results
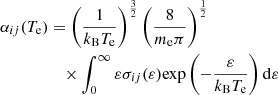
The ground configuration of the Fe8+ ion is [Ne]3s23p6. The energy levels for the ground configurations of the Fe8+, Fe9+, and Fe10+ ions are presented in Fig. 1. In addition, the main excited configurations of Fe8+ and Fe9+ are shown. These configurations play the main role in the formation of Fe9+ by electron impact. The single ionization threshold is 232.3 eV while the energy provided by the National Institute of Standarts and Technology (NIST) equals 233.6 eV (Kramida et al. 2018). The first excited configuration is formed by the 3p → 3d promotion from the ground configuration. The CI energy levels of the first excited configuration varies from 50.730 to 73.893 eV with respect to the ground level (Table 1). The CI leads to a diminishing of energy splitting from 25.566 eV to 23.163 eV for the energy levels of the 3p5 3d configuration.
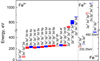 |
Fig. 1. Energy levels of the Fe8+, Fe9+, and Fe10+ ions. Blue (dark) represents even configurations; red (light) represents odd configurations. |
Energy levels (in eV) and lifetimes (in s) for the ground and 3s2 3p5 3d configurations of Fe8+.
The lifetimes for the energy levels of the first excited configuration are shown in Table 1. The presented results correspond to the single and configuration interaction approximations. The CI basis is built by considering configurations that have the largest CIS values calculated from Eq. (2). The convergence for the lifetimes is determined by increasing the CI basis. Also, the 3p4 3d2, 3p4 3d 4d, and 3s 3p6 3d configurations are studied since these configurations show the largest population transfer to 3p5 3d. In addition, configurations produced by radiative cascade from the admixed configurations are included in the CI basis. The total number of 20 606 odd parity configuration state functions that originate from 62 configurations is included in the CI basis. For the even parity configurations, the CI basis consists of 17 872 configuration state functions that are produced by 63 configurations.
Surprisingly, the lifetime of the 3F4 level demonstrates the largest change amongst those of the 3p5 3d configuration when correlation effects are included in the study. The lifetime of the level is diminished by factor of 2.6 from 1302.5 s to 493.2 s. The transition probability from the level presented in the Chianti database (Dere et al. 1997; Landi et al. 2013) amounts to 9.22 × 10⁻⁴ s−1 that corresponds to a lifetime of 1085 s. On the other hand, the increasing of the CI lifetimes compared to the single configuration approximation is observed for many levels of the configuration. The largest effect is obtained for the 1P1 level (index 12), which has the shortest lifetime. The admixed configurations change the lifetime by 36% for the level. Unfortunately, variation of the levels population over time due to radiative cascade does not show a large effect for the 3F4 level even for the extended CI basis when the time range of 15–50 s corresponding to the start and the end of data collection is considered. The population of the level varies in the range from 59% to 56%. On the other hand, population modelling using data from single configuration calculations determines the fractional population of 66% and 64% for 15 and 50 s, respectively. It should be noted that a lifetime of 493.2 s of the 3F4 level is larger compared to the collection time (15–50 s).
The 3F4 level can only decay to the 3P2 level through E2 transitions. Our study, which includes 1844 configuration state functions (CSF) with J = 4 and 2052 CSF with J = 2, leads to a lifetime of 579.4 s. Since our CIS approach does not investigate Brillouin-type configurations, the basis of admixed configurations that in addition includes configurations produced by nl → n′l (n = 2, 3, l = 0, 1, 2, n′ = 3 − 10) excitations from the 3p5 3d configuration leads to 2447 CSF with J = 4 and 3239 CSF with J = 2. The lifetime for the 3F4 level decreases to 522.1 s. Furthermore, an increase of the basis of the admixed configurations (without Brillouin-type configurations) up to 5393 CSF with J = 4 and 5935 CSF with J = 2 leads to 574.9 s for the level. Thus, the decrease of the lifetime from 579.4 s to 574.9 s is observed while CI bases changed from 3896 (1844 + 2052) to 11 328 (5393 + 5935) CSF. As mentioned above, the extended basis of 20 606 CSF that also includes Brillouin-type configurations gives 493.2 s for the lifetime. This suggests that a larger CI basis would not have a significant effect on the lifetime of the level.
The LLDW cross sections produced by electron impact ionization from the ground level and 3F4 level of the 3s23p53d configuration are presented in Fig. 2. The current study does not include the 3P0 level since the population modelling in the time range 15–50 s provides a value of ∼1.8%, which is lower than the fractional level population for the ground and 3F4 levels. A similar result for the first excited level of the Fe8+ ion was obtained by Hahn et al. (2016). For comparison, the sub-configuration average DW (SCADW) data are also shown. Good agreement amongst the LLDW and SCADW values can be seen. The obtained results demonstrate that cross sections for the ground level are approximately a factor of two lower compared to the ones from the 4F3 level. In addition, we have estimated cross sections for the direct double ionization (DDI) process in Fe8+ using a few-step approach (Jonauskas et al. 2014; Koncevičiūtė et al. 2018) The study of the electron-impact single ionization for the Se2+ (Koncevičiūtė et al., 2018) and Se3+ (Koncevičiūtė et al., 2019) ions determined that this process has a diminishing effect on the theoretical cross sections. However, the obtained cross sections for the DDI process in Fe8+ are an order of magnitude lower compared to the DI values. Thus, DDI does not provide any essential change in the theoretical single ionization cross sections.
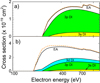 |
Fig. 2. Electron-impact ionization cross sections for a) ground 3s2 3p6 1S0 and b) metastable 3s2 3p5 3d 3F4 levels of Fe8+. The SCADW data are presented by a dashed line for the total cross sections. The shaded areas show contributions from subshells for the DI process: 3s (yellow), 3p (green), 3d (blue). |
Figure 2 shows that DI from the 3p subshell dominates for both presented levels. The ionization from the 3s subshell produces the lowest contribution. It should be mentioned that total DI cross sections for the 4F3 level are approximately 20% higher at the peak compared to the corresponding values of the ground level. The DI from the 2s and 2p subshells mainly leads to double ionization of the Fe8+ ion through the ionization autoionization process and, therefore, is not considered in this study. The electron-impact ionization cross sections for the ground level are presented in Tables 2–5 and for the metastable level in Tables 6–10.
DI 3s cross sections (σ in Mb) of the ground level of Fe8+.
DI 3p cross sections (σ in Mb) of the ground level of Fe8+.
EA cross sections (σ in Mb) of the ground level of Fe8+.
Total cross sections (σ in Mb) of the ground level of Fe8+.
DI 3s cross sections (σ in Mb) of the 3F4 level of Fe8+.
DI 3p cross sections (σ in Mb) of the 3F4 level of Fe8+.
DI 3d cross sections (σ in Mb) of the 3F4 level of Fe8+.
EA cross sections (σ in Mb) of the 3F4 level of Fe8+.
Total cross sections (σ in Mb) of the 3F4 level of Fe8+.
The contribution from the indirect process to the ionization cross sections for the metastable level leads to approximately two times higher total cross sections compared to the ground level. This can be explained by the fact that excitations from the 3p subshell of the 3s2 3p5 3d configuration provide strong EA channels. However, this subshell is the outermost one for the ground configuration and, thus, corresponding excitations do not have an effect on the EA cross sections.
Surprisingly, the excitation from the 2p to the 3d subshell with subsequent autoionization produces the largest contribution to the EA process for the ground level (Fig. 3). The threshold for this excitation is 731 eV. The contribution from the 2p subshell excitations is clearly seen in the total cross sections starting from this energy (Fig. 2a). The same transition was identified as the strongest EA channel for the ground and excited 3s2 3p5 3d configurations using the CADW method (Pindzola et al. 1987). It should be noted that the EA 3s → 6f channel is the strongest one at the lower energies of the incident electron (Fig. 3). Furthermore, the total EA cross sections are approximately 30% higher for the 3s subshell compared to the excitations from the 2p subshell (Fig. 3). It can be seen that the excitations to many autoionizing configurations have to be considered to reach convergence for the 2p and 3s subshells.
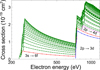 |
Fig. 3. Strongest EA channels for the ground level of Fe8+ for excitations to shells with n ≼ 8: dashed-dotted (blue) line: 2p → 3d, dashed-dotted-dotted (red): 3s → 6f, dotted (magenta): 2p → 4d. |
The situation drastically changes for the EA cross sections corresponding to electron-impact ionization from the 3F4 level of the 3p53d configuration (Fig. 4). The contribution from the 2p subshell is considerably lower compared to the excitations from the 3p subshell. The five strongest EA channels correspond to the 3p → 5f, 3p → 6p, 3p → 6f, 3s → 4f, and 2p → 3d excitations. The next strongest excitation after the 2p subshell occurs to the 4d subshell. However, its influence is an order of magnitude lower compared to 2p → 3d.
 |
Fig. 4. Strongest EA channels for the metastable 3F4 level of Fe8+ for excitations to shells with n ≼ 8: dashed-dotted (blue) line: 3p → 5f, dashed-dotted-dotted (red): 3p → 6p, dotted (magenta): 3p → 6f, solid (grey): 3s → 4f, long-dashed (black): 2p → 3d. |
The EA channels corresponding to excitations from the ground level to the subshells with orbital quantum number l = 3 dominate at the lower energies of the incident electron (Fig. 5). The 3s subshell participates in the formation of the EA cross sections in the energy region from the threshold up to ∼730 eV where the EA 2p channel opens. The excitations from 2p to l = 2 make the largest contribution at the higher energies. The 2p → 3d excitation provides ∼50% of the total cross sections for the peak values in this energy region. We see that radiative damping has a crucial effect on the EA values corresponding to the excitations to l = 0 at the lower energy side. However, the configurations produced by the excitations from the 2s and 2p subshells mainly decay to the next ionization stage without a significant effect from the radiative damping.
 |
Fig. 5. Contribution of the EA channels corresponding to excitations from the ground level to shells with different orbital quantum numbers with (panel a) and without (panel b) radiative damping. |
The excitations to orbital quantum number l = 3 produce the largest contribution to the EA cross sections for the metastable level in all energy ranges (Fig. 6). For the excitations up to subshells with n = 8, it gives approximately half of the total cross sections (Fig. 4). For the higher shells, the excitations to the subshells with l = 3 also dominate but with the lower weight. Similar results are also obtained for the SCADW values. However, the excitations to the subshells with l = 1 provide the second largest contribution in contrast to the results obtained for the ground level. This can be explained by the fact that promotion of the electron from the 3p subshell leads to autoionizing states for the metastable level. The radiative damping diminishes the EA cross sections for the strongest channels up to 20%.
 |
Fig. 6. Contribution of the EA channels corresponding to excitations from the metastable 3F4 level to shells with different orbital quantum numbers with (panel a) and without (panel b) radiative damping. |
It is important to ensure convergence of the EA cross sections due to excitations to the high-nl subshells. It was demonstrated that excitations to the high-nl subshells can have a crucial effect for the tungsten ions (Zhang & Kwon 2014; Jonauskas et al. 2015a; Kynienė et al. 2015, 2016). Figure 7 demonstrates the changes of the 3F4 EA cross sections for the excitations from the 3s and 3p subshells up to shells with n = 5, 10, and 20. The presented data show that the excitations to the shells with n > 10 increase the EA cross sections by ∼7% for the 3s subshell and ∼12% for the 3p subshell. The influence of the excitations to the higher shells (20 < n ≼ 40) is studied using the SCADW approach. The determined contribution to the total cross sections is lower than 2% for the ground and 3F4 levels.
 |
Fig. 7. Contribution of excitations to the shells with n ≼ 5 (blue), n ≼ 10 (green), and n ≼ 20 (red) from the 3s (panel a) and 3p (panel b) subshells for the metastable 3F4 level. The cross sections calculated without radiative damping are represented by dashed lines. |
The excited configurations can also decay through radiative transitions. This leads to radiative damping of the EA cross sections. The radiative damping diminishes the total EA cross sections for the metastable level by ∼12% for the 3s subshell and ∼15% for the 3p subshell (Fig. 7). The influence of the radiative damping on the EA process from the 3s subshell is lower than 11% for the ground level. It should be noted that the radiative damping is less important for the total ionization cross sections of the ground level compared to the metastable one, since the DI part dominates in the first case.
Our obtained values for ionization from the ground and metastable 3s23p53d 3F4 levels are compared with experimental data in Fig. 8. It can be seen that better agreement with measurements for electron energies up to 500 eV and above 900 eV occurs when 15% of the ions in the beam reside in the metastable state. However, these values are below the experimental data for the peak energies but still within the error bars. The previous calculations using the CADW approach determined ∼30% for the metastable fraction. It should be noted that CADW calculations (Hahn et al. 2016) provide ∼40% higher cross sections compared to the LLDW values for the ground level. On the other hand, our cross sections are only ∼10% above the CADW ones for the 3F4 level. However, the previous calculations included only 3s → 4l transitions for the 3s2 3p5 3d configuration (Hahn et al. 2016). Our presented results demonstrate a very strong contribution from the excitations to shells with n = 5 and n = 6 (Fig. 5). Many of the configurations produced by these excitations are just above, or their energy levels straddle, the ionization threshold (Fig. 1). This leads to the high values for the EA process. Therefore, the full CADW calculations for the metastable level would produce a much higher contribution from the ground level in the fitting procedure. This would lead to much lower values for the metastable fraction.
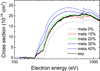 |
Fig. 8. Comparison of theoretical cross sections with experimental values. The metastable fraction is shown by the different lines. |
It should be noted that the obtained data contradict the results determined from the population modelling using the Boltzmann distribution. This suggests that other mechanisms of the level population have to be considered. Further studies could include a full collisional-radiative model for the interaction regime to define the initial level population for the subsequent radiative cascade. The time-dependent modelling of the radiative cascade would be performed from the last injection to the end of data collection. The similar approach used before demonstrated different intensities for spectral lines compared to the ones obtained only from the collisional-radiative model (Jonauskas et al. 2013, 2015b). What is more, the lower value of the lifetime for the 3F4 level would lead to the lower fractional population. The calculations show that the lifetime would have to be lower by approximately an order of magnitude than the currently used value so that it would correspond to the population of the level determined from cross section comparison. However, it is highly doubtful that the larger CI basis would lead to significant change in the lifetime.
It should be noted that calculations of the cross sections using the DW approximation usually provide a good agreement with measurements for the highly ionized ions (Loch et al. 2005; Kwon & Savin 2012; Zhang & Kwon 2014; Borovik et al. 2015). The Fe8+ ion should not be the exception. This means that additional measurements may help to resolve the disagreement between the different methods. On the other hand, more sophisticated calculations for the lifetimes of the energy levels of the 3s23p53d configuration are also needed.
Finally, the Maxwellian rate coefficients for the ground and metastable levels are presented in Table 11. The data are shown for the DI, EA, and total ionization.
Maxwellian rate coefficients for the 3s2 3p6 1S0 and the 3s2 3p5 3d 3F4 levels in cm3 s−1.
4. Conclusions
Electron-impact ionization cross sections have been studied for the ground and metastable 3s23p53d 3F4 levels of the Fe8+ ion. Convergence for the EA cross sections due to excitations to the high-nl subshells has been investigated. The cross sections for the metastable level are approximately a factor of two higher compared to values for the ground level.
The study demonstrates that excitations to subshells with orbital quantum number l = 3 dominate for the ground and metastable levels of the Fe8+ ion at the lower energy side. For the ground level at energies above 731 eV, the 2p subshell opens, which leads to the strong increase of the EA cross sections due to excitations to the subshells with l = 2.
The presented results are compared with the recent TSR measurements. Modelling of theoretical cross sections for the ground and metastable levels to produce the best fit to measurements shows that 15% of the ions in the ion beam reside in the metastable state. On the other hand, modelling of the levels population over time using the Boltzmann distribution for the initial population provides 59%−50% for the metastable level. This suggests that other mechanisms of the levels population have to be considered. On the other hand, the radiative decay processes have to be analysed for energy levels of the 3s23p53d configuration using the larger CI bases or other approaches.
Radiative decay from the levels of the 3s23p53d configuration are investigated using the extended CI basis. The correlation effects diminish the lifetime of the 3p53d 3F4 level by approximately three times from 1302 s to 493 s compared to calculations from the single configuration approximation.
Acknowledgments
Part of the computations were performed on resources at the High Performance Computing Center “HPC Saulėtekis” at Vilnius University, Faculty of Physics.
References
- Bernhardt, D., Becker, A., Grieser, M., et al. 2014, Phys. Rev. A, 90, 012702 [NASA ADS] [CrossRef] [Google Scholar]
- Beiersdorfer, P., Lepson, J. K., Desai, P., Díaz, F., & Ishikawa, Y. 2014, ApJS, 210, 16 [NASA ADS] [CrossRef] [Google Scholar]
- Borovik, Jr., A. B., Gharaibeh, M. F., Schippers, S., & Müller, A. 2015, J. Phys. B: At. Mol. Opt. Phys., 48, 035203 [NASA ADS] [CrossRef] [Google Scholar]
- Butler, K., & Moores, D. L. 1985, J. Phys. B: At. Mol. Opt. Phys., 18, 1247 [NASA ADS] [CrossRef] [Google Scholar]
- Cowan, R. D. 1981, The Theory of Atomic Structure and Spectra (Berkeley, CA: University of California Press) [Google Scholar]
- Dere, K. P. 2007, A&A, 466, 771 [NASA ADS] [CrossRef] [EDP Sciences] [Google Scholar]
- Dere, K. P., Landi, E., Mason, H. E., Monsignori Fossi, B. C., & Young, P. R. 1997, A&AS, 125, 149 [NASA ADS] [CrossRef] [EDP Sciences] [Google Scholar]
- Freund, R. S., Robert, C., Shul, R. J., et al. 1990, Phys. Rev. A, 41, 7 [Google Scholar]
- Gabriel, A. H., Fawcett, B. C., & Jordan, C. 1966, Proc. Phys. Soc., 87, 825 [NASA ADS] [CrossRef] [Google Scholar]
- Gregory, D. C., Meyer, F. W., Müller, A., & Defrance, P. 1986, Phys. Rev. A, 34, 3657 [NASA ADS] [CrossRef] [Google Scholar]
- Gregory, D. C., Wang, L. J., Meyer, F. W., & Rinn, K. 1987, Phys. Rev. A, 35, 3256 [NASA ADS] [CrossRef] [Google Scholar]
- Gu, M. F. 2008, Can. J. Phys., 86, 675 [NASA ADS] [CrossRef] [Google Scholar]
- Hahn, M., Grieser, M., Krantz, C., et al. 2011, ApJ, 735, 105 [NASA ADS] [CrossRef] [Google Scholar]
- Hahn, M., Becker, A., Grieser, M., et al. 2012, ApJ, 760, 80 [NASA ADS] [CrossRef] [Google Scholar]
- Hahn, M., Becker, A., Bernhardt, D., et al. 2013, ApJ, 767, 47 [NASA ADS] [CrossRef] [Google Scholar]
- Hahn, M., Becker, A., Bernhardt, D., et al. 2015, ApJ, 813, 16 [NASA ADS] [CrossRef] [Google Scholar]
- Hahn, M., Becker, A., Bernhardt, D., et al. 2016, J. Phys. B: At. Mol. Opt. Phys., 49, 084006 [NASA ADS] [CrossRef] [Google Scholar]
- Hummer, D. G., Berrington, K. A., Eissner, W., et al. 1993, A&A, 279, 298 [NASA ADS] [Google Scholar]
- Jonauskas, V., Karazija, R., & Kučas, S. 2008, J. Phys. B: At. Mol. Opt. Phys., 41, 215005 (5pp) [NASA ADS] [CrossRef] [Google Scholar]
- Jonauskas, V., Kisielius, R., Kynienė, A., Kučas, S., & Norrington, P. H. 2010, Phys. Rev. A, 81, 012506 [NASA ADS] [CrossRef] [Google Scholar]
- Jonauskas, V., Kučas, S., & Karazija, R. 2011, Phys. Rev. A, 84, 053415 [NASA ADS] [CrossRef] [Google Scholar]
- Jonauskas, V., Gaigalas, G., & Kučas, S. 2012, Atom. Data Nucl. Data, 98, 19 [NASA ADS] [CrossRef] [Google Scholar]
- Jonauskas, V., Masys, Š., Kynienė, A., & Gaigalas, G. 2013, J. Quant. Spectr. Rad. Transf., 127, 64 [NASA ADS] [CrossRef] [Google Scholar]
- Jonauskas, V., Prancikevičius, A., Masys, Š., & Kynienė, A. 2014, Phys. Rev. A, 89, 052714 [NASA ADS] [CrossRef] [Google Scholar]
- Jonauskas, V., Kynienė, A., Merkelis, G., et al. 2015a, Phys. Rev. A, 91, 012715 [NASA ADS] [CrossRef] [Google Scholar]
- Jonauskas, V., Pütterich, T., Kučas, S., et al. 2015b, J. Quant. Spectr. Rad. Transf., 160, 22 [NASA ADS] [CrossRef] [Google Scholar]
- Karazija, R., & Kučas, S. 2013, J. Quant. Spectr. Rad. Transf., 129, 131 [Google Scholar]
- Koncevičiūtė, J., Kučas, S., Masys, Š., Kynienė, A., & Jonauskas, V. 2018, Phys. Rev. A, 97, 012705 [NASA ADS] [CrossRef] [Google Scholar]
- Koncevičiūtė, J., Kučas, S., Kynienė, A., Masys, Š., & Jonauskas, V. 2019, J. Phys. B: At. Mol. Opt. Phys., 52, 025203 [NASA ADS] [CrossRef] [Google Scholar]
- Kučas, S., Jonauskas, V., & Karazija, R. 1997, Phys. Scr, 55, 667 [CrossRef] [Google Scholar]
- Kramida, A., Ralchenko, Y., & Reader, J. 2018, NIST ASD Team 2018, NIST Atomic Spectra Database (ver. 5.5.6), available: https://physics.nist.gov, (Gaithersburg, MD: National Institute of Standards and Technology) [Google Scholar]
- Kwon, D.-H., & Savin, D. W. 2012, Phys. Rev. A, 86, 022701 [NASA ADS] [CrossRef] [Google Scholar]
- Kynienė, A., Jonauskas, V., Kučas, S., & Karazija, R. 2008, Lith. J. Phys., 48, 219 [CrossRef] [Google Scholar]
- Kynienė, A., Masys, Š., & Jonauskas, V. 2015, Phys. Rev. A, 91, 062707 [NASA ADS] [CrossRef] [Google Scholar]
- Kynienė, A., Pakalka, S., Masys, Š., & Jonauskas, V. 2016, J. Phys. B: At. Mol. Opt. Phys., 49, 185001 [NASA ADS] [CrossRef] [Google Scholar]
- Landi, E., Young, P. R., Dere, K. P., Zanna, G. D., & Mason, H. E. 2013, ApJ, 763, 86 [NASA ADS] [CrossRef] [Google Scholar]
- Linkemann, J., Müller, A., Kenntner, J., et al. 1995, Phys. Rev. Lett., 74, 4173 [NASA ADS] [CrossRef] [Google Scholar]
- Loch, S., Ludlow, J., Pindzola, M., Whiteford, A., & Griffin, D. 2005, Phys. Rev. A, 72, 052716 [NASA ADS] [CrossRef] [Google Scholar]
- Lotz, W. 1968, Z. Phys., 216, 241 [NASA ADS] [CrossRef] [Google Scholar]
- Montague, R. G., Diserens, M. J., & Harrison, M. F. A. 1984, J. Phys. B: At. Mol. Opt. Phys., 17, 2085 [NASA ADS] [CrossRef] [Google Scholar]
- Mueller, D. W., Morgan, T. J., Dunn, G. H., Gregory, D. C., & Crandall, D. H. 1985, Phys. Rev. A, 31, 2905 [NASA ADS] [CrossRef] [Google Scholar]
- Palaudoux, J., Lablanquie, P., Andric, L., et al. 2010, Phys. Rev. A, 82, 043419 [NASA ADS] [CrossRef] [Google Scholar]
- Pindzola, M. S., Griffin, D. C., & Bottcher, C. 1986, Phys. Rev. A, 34, 3668 [NASA ADS] [CrossRef] [Google Scholar]
- Pindzola, M. S., Griffin, D. C., Bottcher, C., Younger, S. M., & Hunter, H. T. 1987, Nucl. Fusion, 27, 21 [CrossRef] [Google Scholar]
- Pindzola, M. S., & Loch, S. D. 2018, J. Phys. B: At. Mol. Opt. Phys., 51, 015202 [NASA ADS] [CrossRef] [Google Scholar]
- Phillips, K. J. H., Feldman, U., & Landi, E. 2012, Ultraviolet and X-ray Spectroscopy of the Solar Atmosphere (Cambridge: Cambridge Univ. Press) [Google Scholar]
- Radžiūtė, L., Gaigalas, G., Kato, D., et al. 2015, J. Quant. Spectr. Rad. Transf., 152, 94 [NASA ADS] [CrossRef] [Google Scholar]
- Stenke, M., Aichele, K., Hartenfeller, U., et al. 1999, J. Phys. B: At. Mol. Opt. Phys., 32, 3627 [NASA ADS] [CrossRef] [Google Scholar]
- Wong, K. L., Beiersdorfer, P., Chen, M. H., & Marrs, R. E. 1993, Phys. Rev. A, 48, 2850 [NASA ADS] [CrossRef] [Google Scholar]
- Zhang, D.-H., & Kwon, D.-H. 2014, J. Phys. B: At. Mol. Opt. Phys., 47, 075202 [NASA ADS] [CrossRef] [Google Scholar]
All Tables
Energy levels (in eV) and lifetimes (in s) for the ground and 3s2 3p5 3d configurations of Fe8+.
Maxwellian rate coefficients for the 3s2 3p6 1S0 and the 3s2 3p5 3d 3F4 levels in cm3 s−1.
All Figures
|
Fig. 1. Energy levels of the Fe8+, Fe9+, and Fe10+ ions. Blue (dark) represents even configurations; red (light) represents odd configurations. |
| In the text | |
|
Fig. 2. Electron-impact ionization cross sections for a) ground 3s2 3p6 1S0 and b) metastable 3s2 3p5 3d 3F4 levels of Fe8+. The SCADW data are presented by a dashed line for the total cross sections. The shaded areas show contributions from subshells for the DI process: 3s (yellow), 3p (green), 3d (blue). |
| In the text | |
|
Fig. 3. Strongest EA channels for the ground level of Fe8+ for excitations to shells with n ≼ 8: dashed-dotted (blue) line: 2p → 3d, dashed-dotted-dotted (red): 3s → 6f, dotted (magenta): 2p → 4d. |
| In the text | |
|
Fig. 4. Strongest EA channels for the metastable 3F4 level of Fe8+ for excitations to shells with n ≼ 8: dashed-dotted (blue) line: 3p → 5f, dashed-dotted-dotted (red): 3p → 6p, dotted (magenta): 3p → 6f, solid (grey): 3s → 4f, long-dashed (black): 2p → 3d. |
| In the text | |
|
Fig. 5. Contribution of the EA channels corresponding to excitations from the ground level to shells with different orbital quantum numbers with (panel a) and without (panel b) radiative damping. |
| In the text | |
|
Fig. 6. Contribution of the EA channels corresponding to excitations from the metastable 3F4 level to shells with different orbital quantum numbers with (panel a) and without (panel b) radiative damping. |
| In the text | |
|
Fig. 7. Contribution of excitations to the shells with n ≼ 5 (blue), n ≼ 10 (green), and n ≼ 20 (red) from the 3s (panel a) and 3p (panel b) subshells for the metastable 3F4 level. The cross sections calculated without radiative damping are represented by dashed lines. |
| In the text | |
|
Fig. 8. Comparison of theoretical cross sections with experimental values. The metastable fraction is shown by the different lines. |
| In the text | |
Current usage metrics show cumulative count of Article Views (full-text article views including HTML views, PDF and ePub downloads, according to the available data) and Abstracts Views on Vision4Press platform.
Data correspond to usage on the plateform after 2015. The current usage metrics is available 48-96 hours after online publication and is updated daily on week days.
Initial download of the metrics may take a while.