Fig. 8
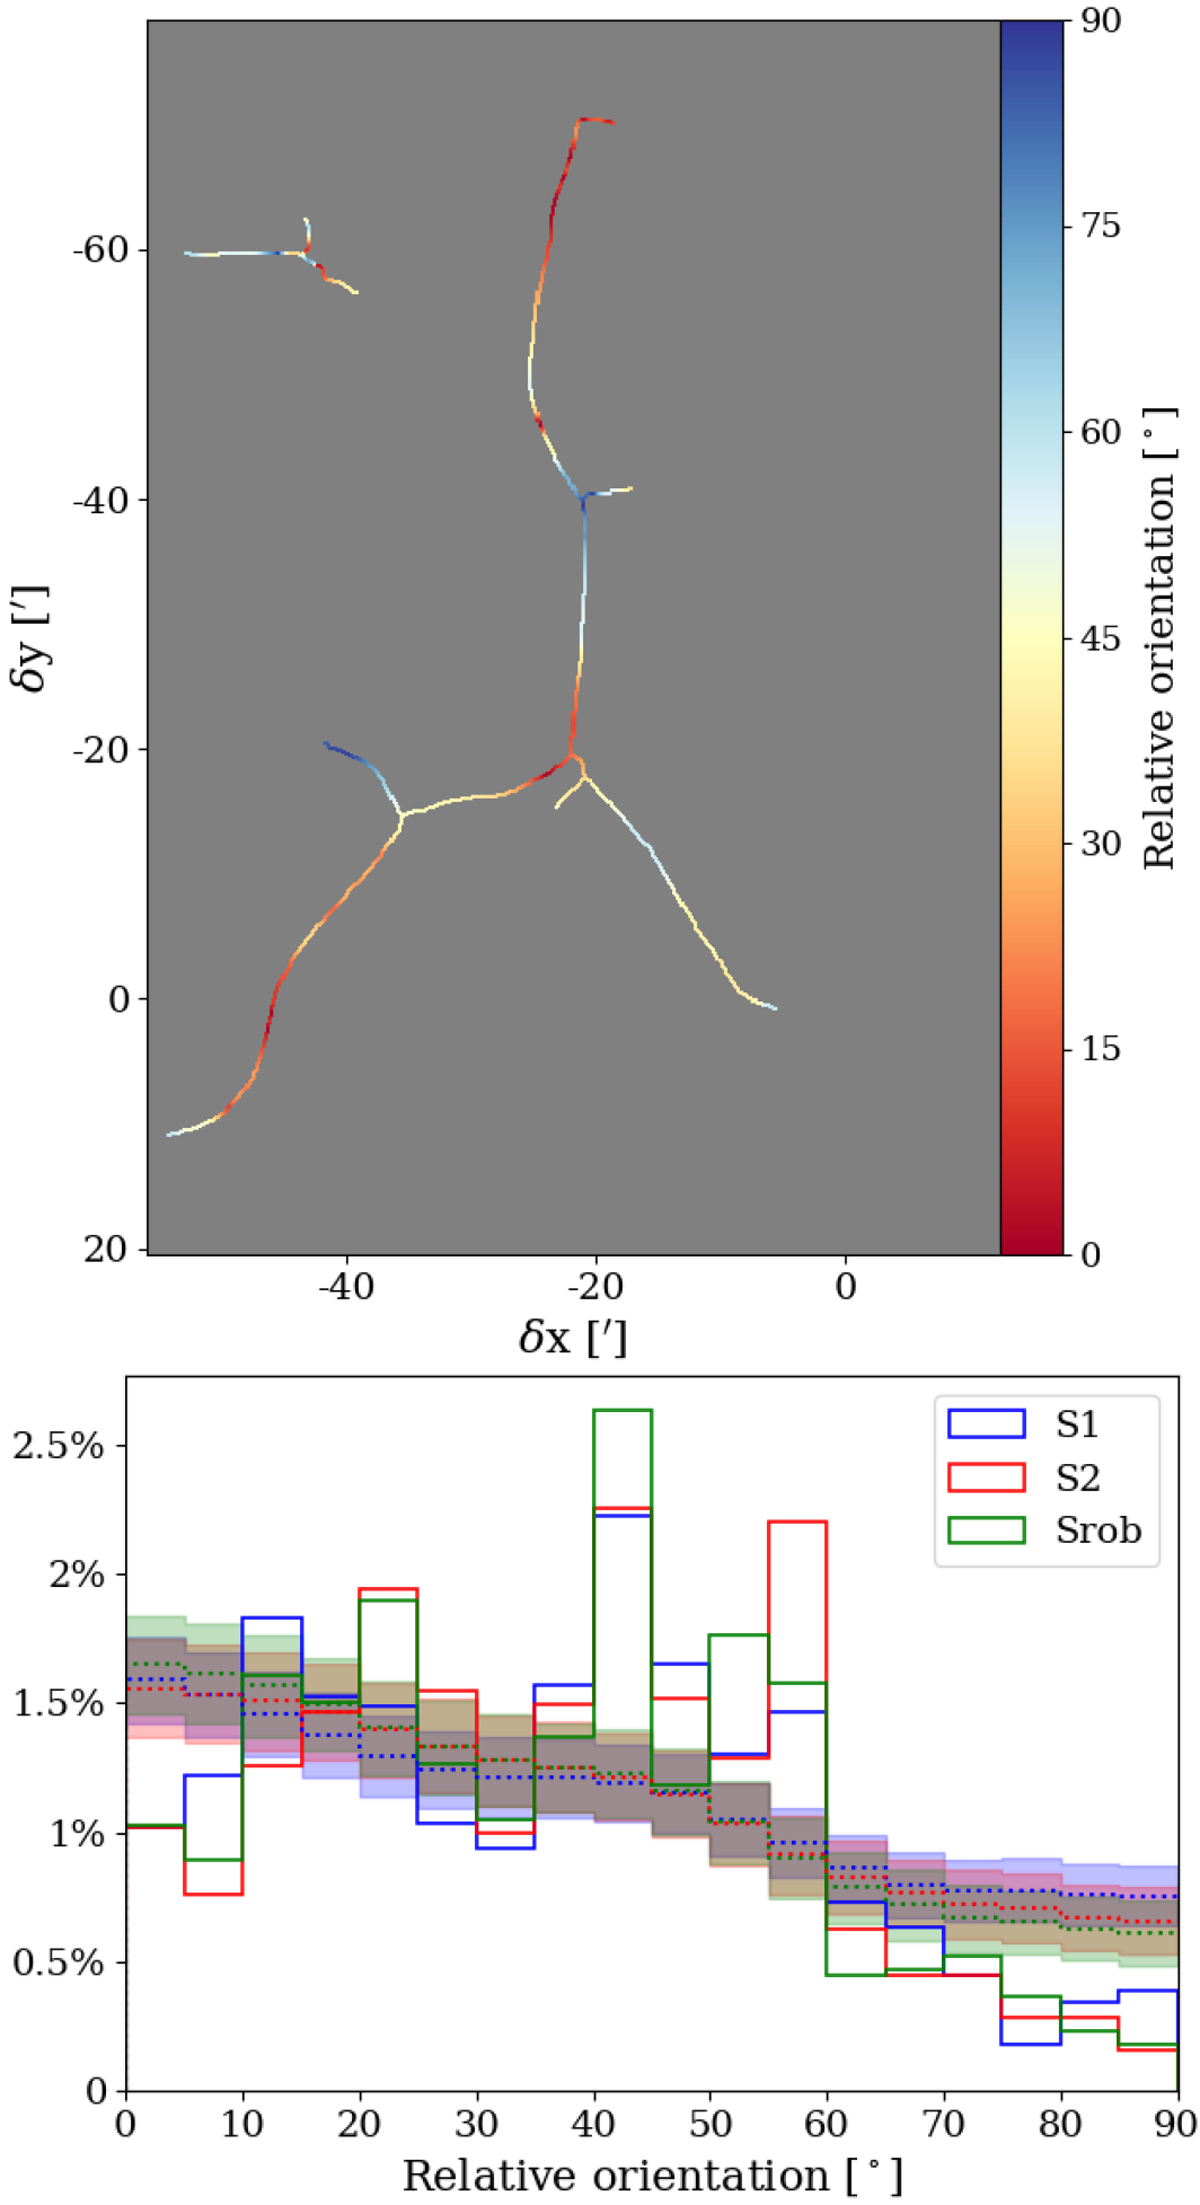
Top: map of the angle between the magnetic field and filaments detected in Orion B at a 5′ resolution. The filaments are red when they are parallel to the magnetic field and blue when perpendicular to it. Bottom: distribution of the relative orientation of the filaments and the magnetic field for the S1, S2, and robust skeletons. The dotted lines (and the shaded areas) present the distribution (and the corresponding ± 1σ uncertainties) that we would get if the two quantities were uncorrelated. The uncorrelated distribution is obtained by a Monte Carlo sampling of the magnetic field and filament position angles.
Current usage metrics show cumulative count of Article Views (full-text article views including HTML views, PDF and ePub downloads, according to the available data) and Abstracts Views on Vision4Press platform.
Data correspond to usage on the plateform after 2015. The current usage metrics is available 48-96 hours after online publication and is updated daily on week days.
Initial download of the metrics may take a while.