Fig. 5
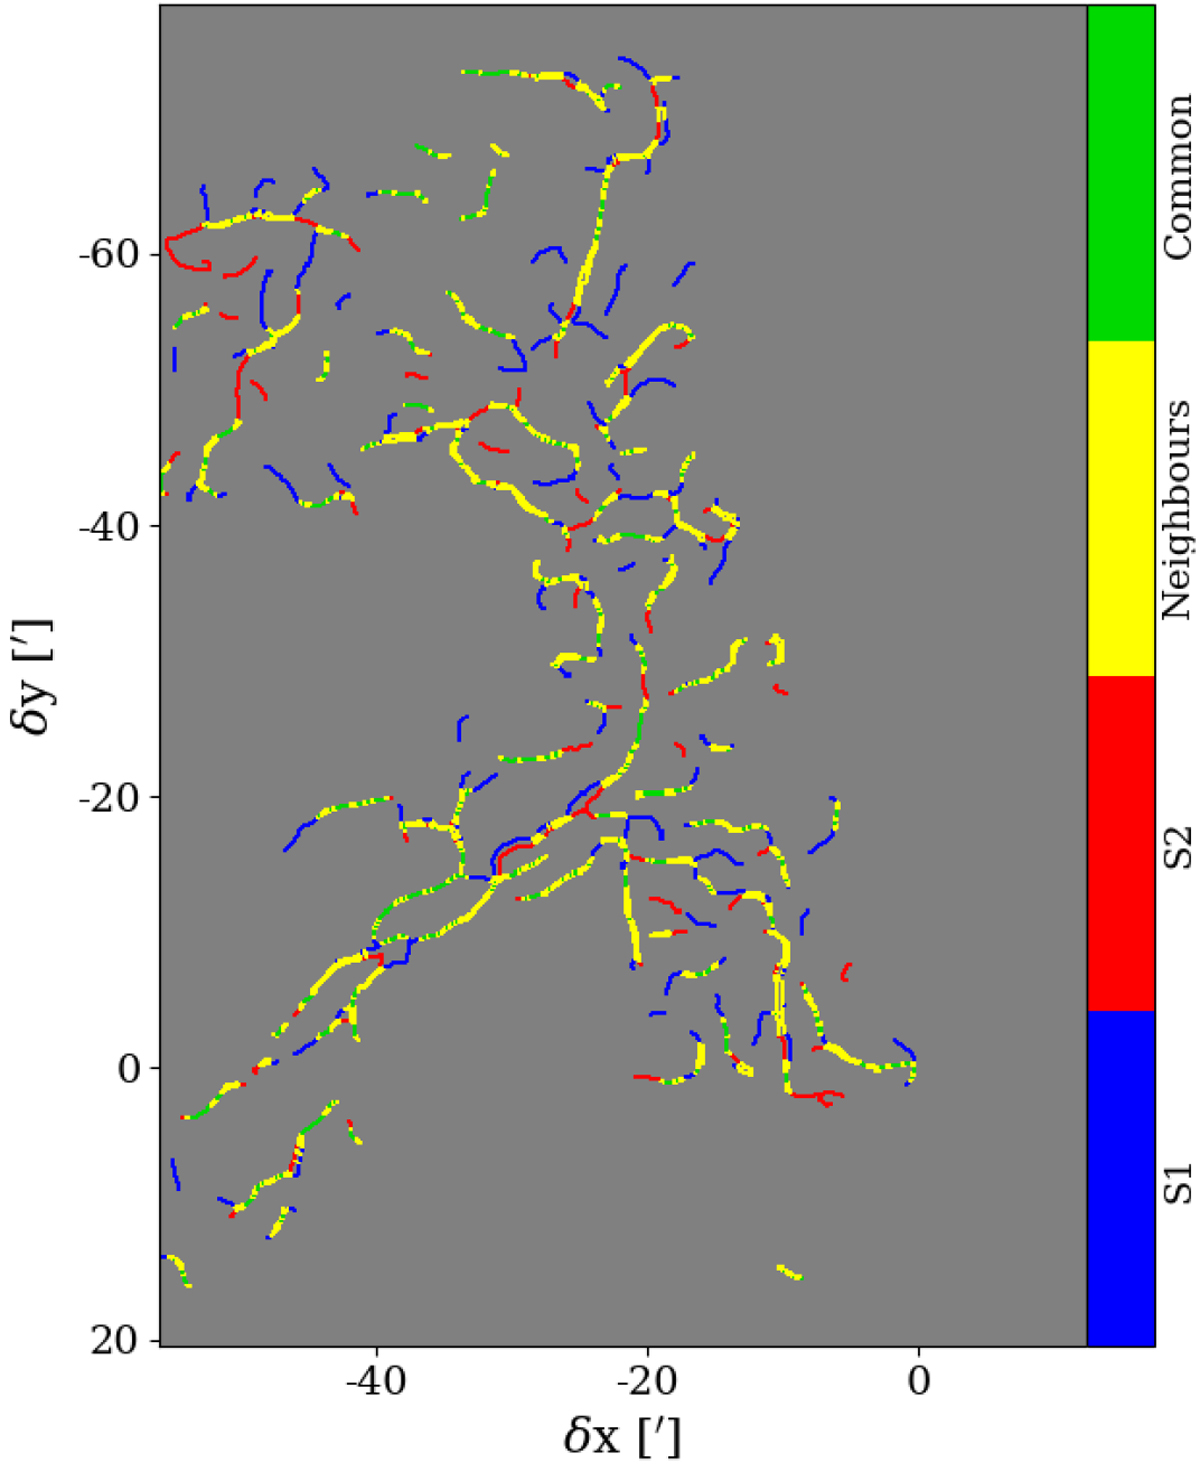
Comparison of the skeletons obtained with the two different methods. The S1 skeleton denotes the skeleton obtained by simple thresholding, and S2 is obtained by the adaptive method with ridge detection. The structures only identified by one method appear in red or blue, the structures common to both methods appear in green if they perfectly match, and in yellow in the cases where the morphological thinning led to small position offsets (see Appendix B).
Current usage metrics show cumulative count of Article Views (full-text article views including HTML views, PDF and ePub downloads, according to the available data) and Abstracts Views on Vision4Press platform.
Data correspond to usage on the plateform after 2015. The current usage metrics is available 48-96 hours after online publication and is updated daily on week days.
Initial download of the metrics may take a while.