Fig. 3
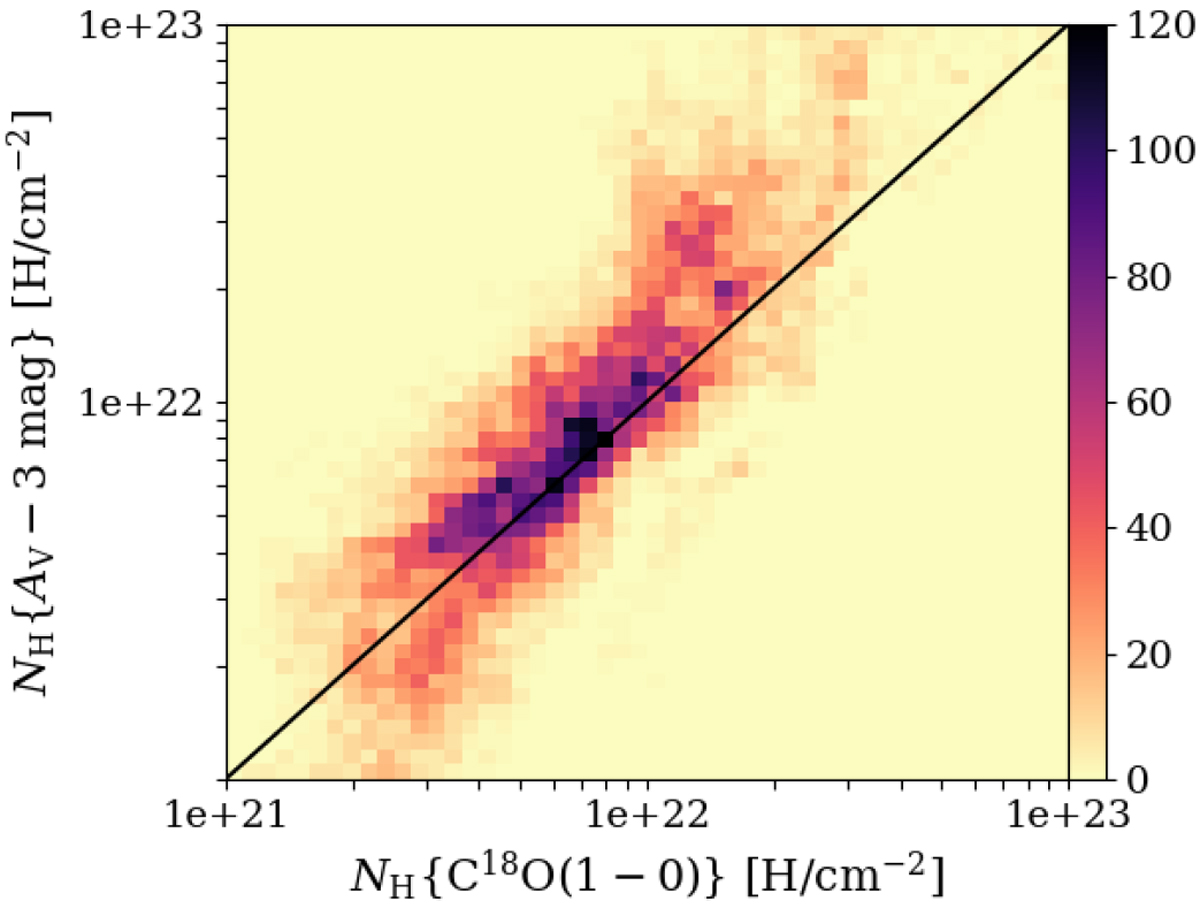
Joint distributions of the NH column densities as traced by C18O (J = 1−0) against those inferred from AV with an offsets of 3 magnitudes. This threshold corresponds to the extinctions at which the molecular tracers starts to be detected according to Pety et al. (2017). The distribution is computed in the identified filamentary regions. The 1:1 relation is overplotted as a black line.
Current usage metrics show cumulative count of Article Views (full-text article views including HTML views, PDF and ePub downloads, according to the available data) and Abstracts Views on Vision4Press platform.
Data correspond to usage on the plateform after 2015. The current usage metrics is available 48-96 hours after online publication and is updated daily on week days.
Initial download of the metrics may take a while.