Fig. 2
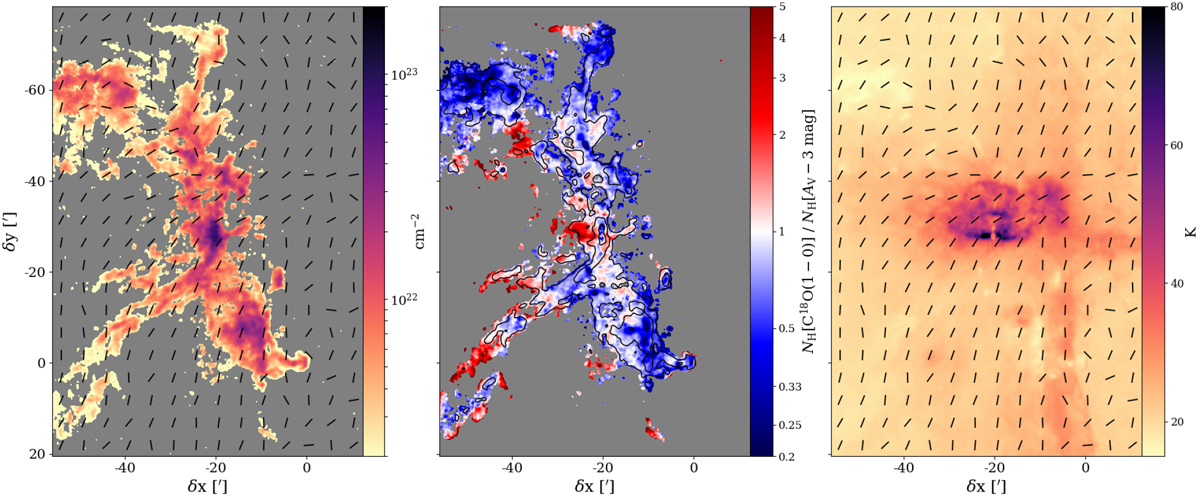
Left: NH column density map derived from the C18O (J = 1−0) integrated intensity (multi-Gaussian model). The orientation of the magnetic field, derived from Planck polarimetric data, is shown by the black segments. The spacing of the segments corresponds to the 5′ beam of Planck. Middle: map of the ratio of the C18O-traced NH to the dust-traced NH above 3 magnitudes of AV in Orion B. Superimposed are contours of the C18O (J = 1−0) integrated intensity at 0.75, 2.5 and 7.5 K km s−1. Right: effective dust temperature map computed by Lombardi et al. (2014). The black segments again show the orientation of the magnetic field.
Current usage metrics show cumulative count of Article Views (full-text article views including HTML views, PDF and ePub downloads, according to the available data) and Abstracts Views on Vision4Press platform.
Data correspond to usage on the plateform after 2015. The current usage metrics is available 48-96 hours after online publication and is updated daily on week days.
Initial download of the metrics may take a while.