Fig. B.2
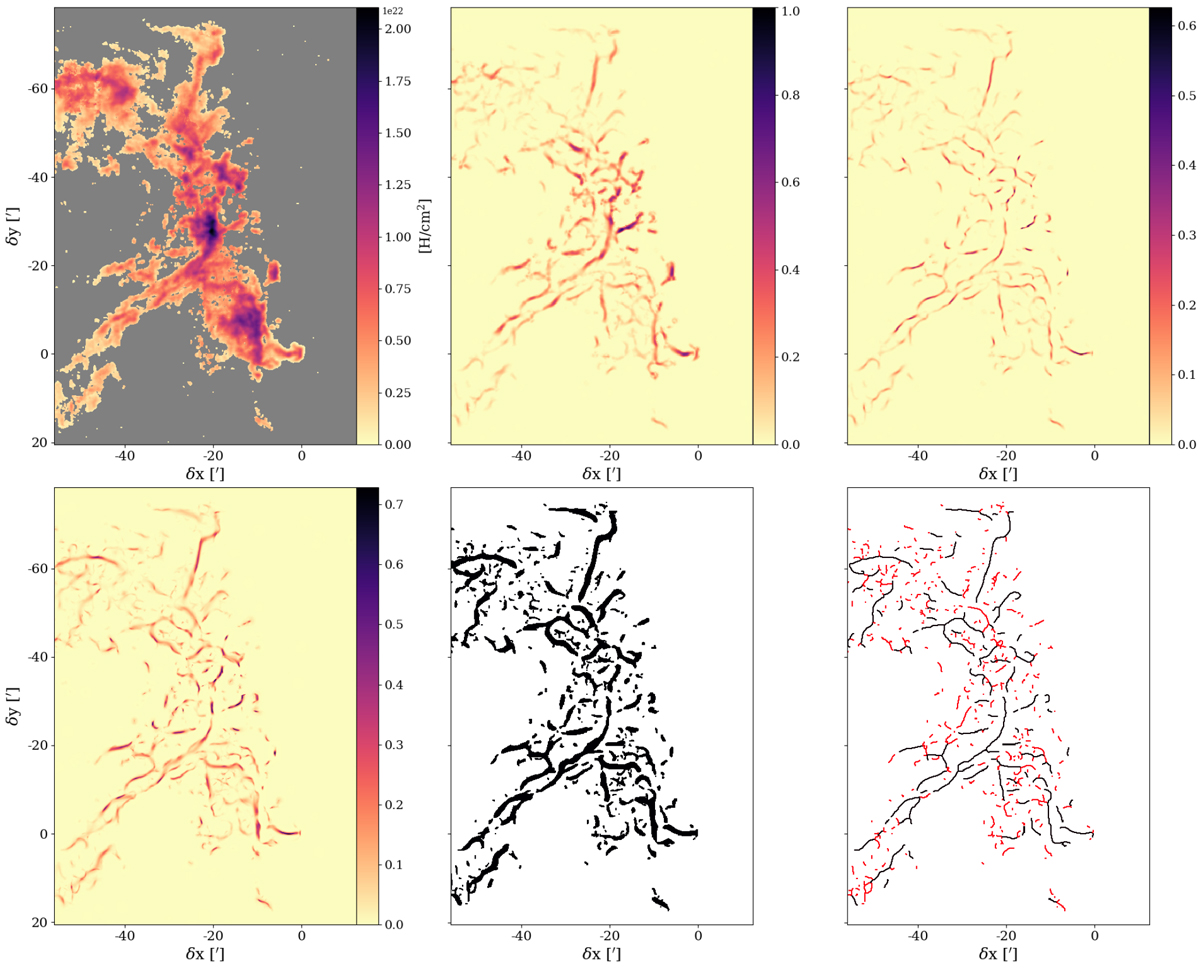
From left to right and top to bottom: (1) column density (Fig. B.1, panel 3) after an asinh transform (colour scale is linear, not logarithmic); (2) structures resulting from the aspect-ratio filter of Frangi et al. (1998) applied to the Hessian eigenvalues of the transformed column density, with a single detection scale of 0.14 pc; (3) the samestructures after applying a gradient-based ridge-detection filter, with the same detection scale; (4) the result of the multi-scale (0.06–0.3 pc) filtering; (5) regions identified as filamentary, by applying a threshold onto the multi-scale filtered map; and (6) skeleton obtained by morphological thinning of these regions. The filaments that end up being eliminated at some point in the cleaning process are indicated in red.
Current usage metrics show cumulative count of Article Views (full-text article views including HTML views, PDF and ePub downloads, according to the available data) and Abstracts Views on Vision4Press platform.
Data correspond to usage on the plateform after 2015. The current usage metrics is available 48-96 hours after online publication and is updated daily on week days.
Initial download of the metrics may take a while.