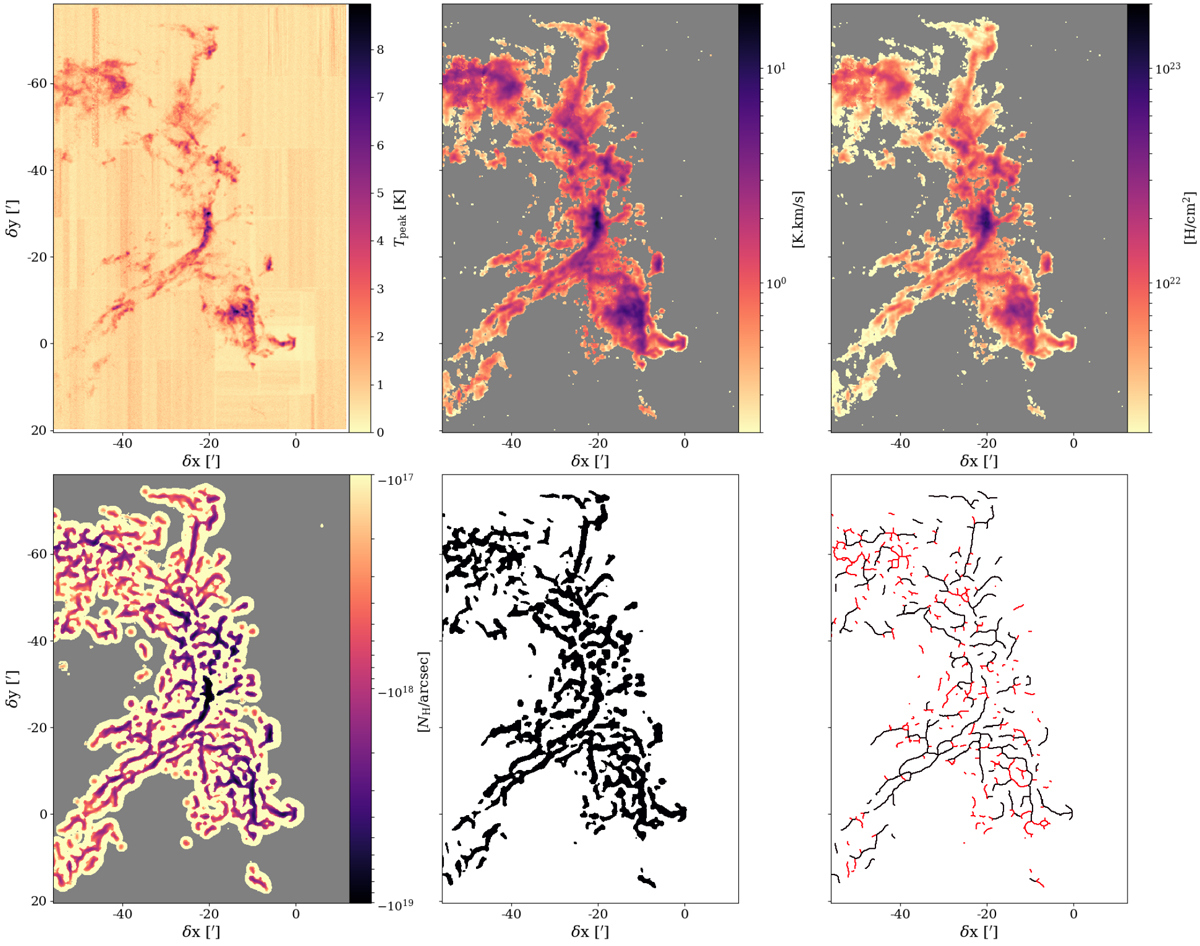
Fig. B.1

From left to right and top to bottom: (1) peak temperature of the raw C18O (J = 1−0) data; (2)integrated intensity of the multi-Gaussian fit result; (3) column density estimate derived from this integrated intensity and the dust temperature; (4) largest (in absolute value) eigenvalue ε2 of the Hessian matrix computed at each point of the column density map; (5) regions identified as filamentary, by applying a threshold onto the ε2 map; and (6) skeleton obtained by morphological thinning of these regions. The filaments that are eliminated at some point in the cleaning process are indicated in red.
Current usage metrics show cumulative count of Article Views (full-text article views including HTML views, PDF and ePub downloads, according to the available data) and Abstracts Views on Vision4Press platform.
Data correspond to usage on the plateform after 2015. The current usage metrics is available 48-96 hours after online publication and is updated daily on week days.
Initial download of the metrics may take a while.


