Fig. 11
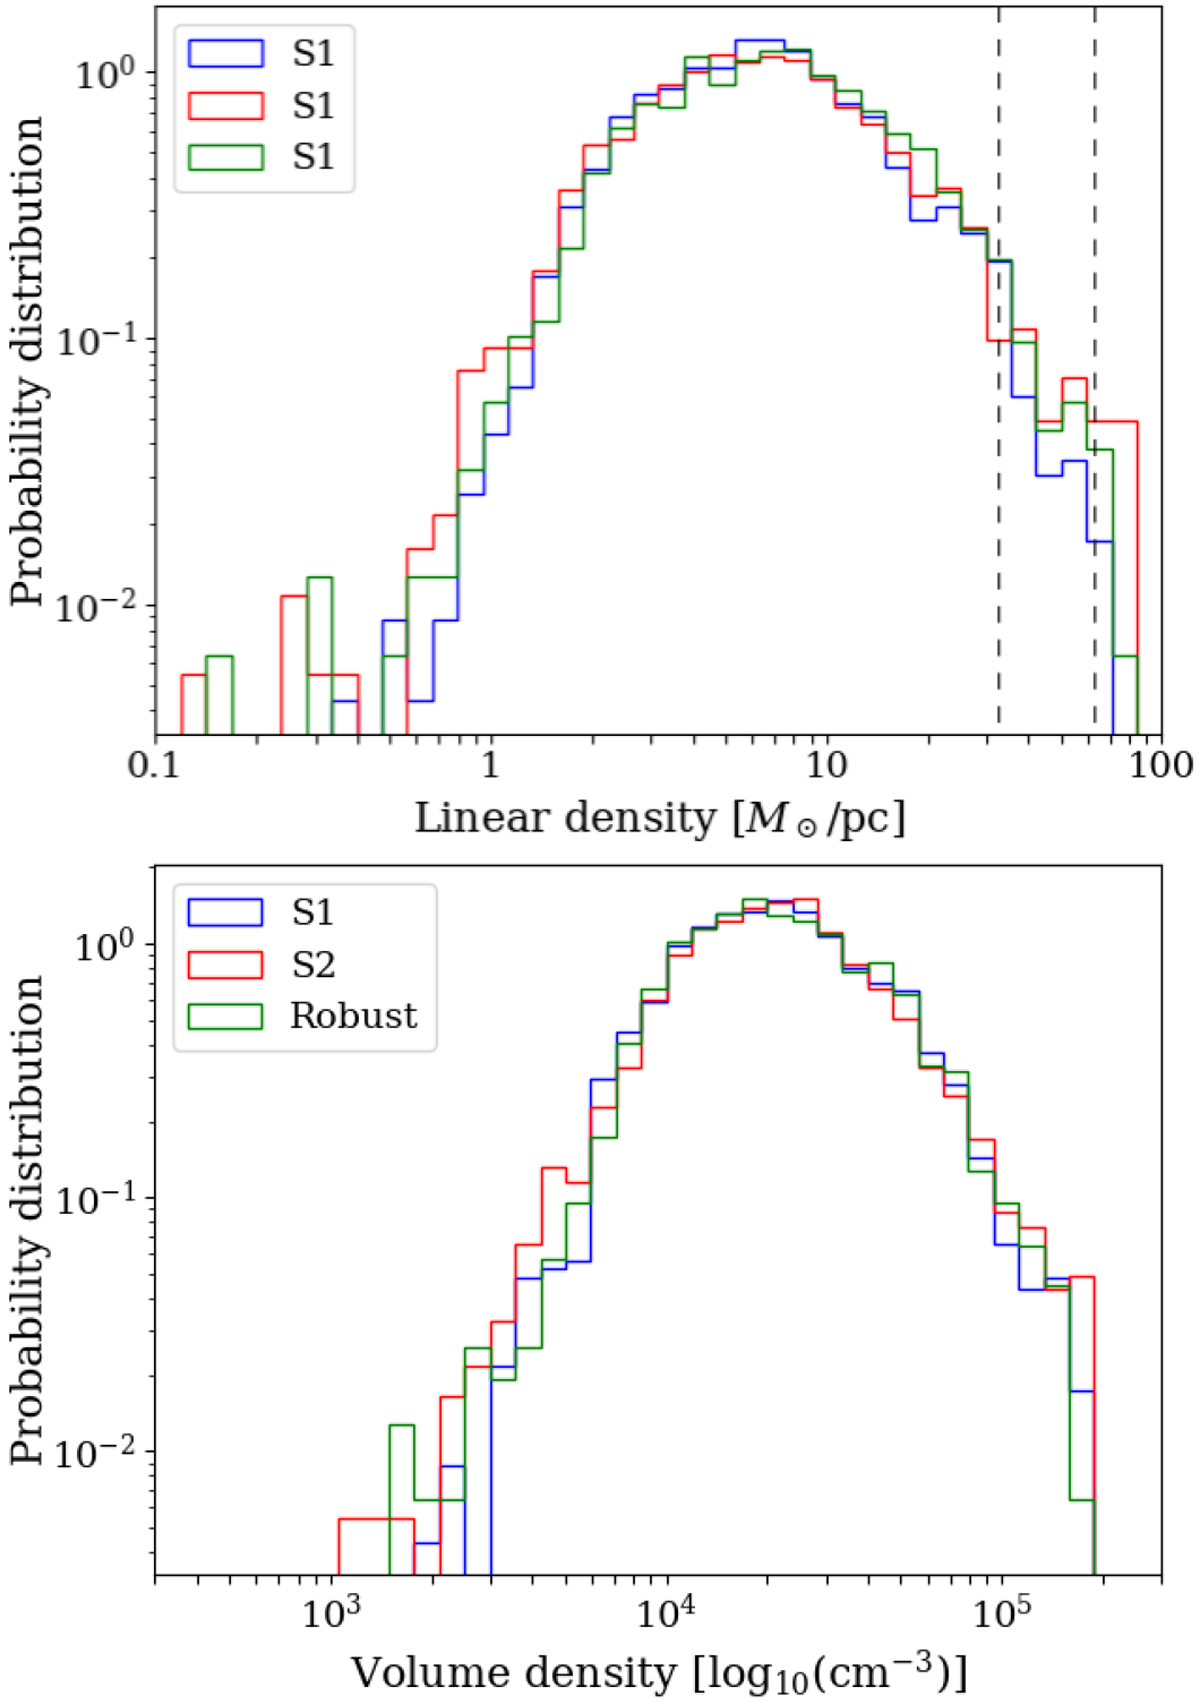
Top: distribution of the linear density of the filaments. The vertical dashed lines show the most probable critical linear densities corresponding to ![]() and
and ![]() . Bottom: distribution of the volume density of the filaments, derived from the linear density and the FWHM of the transverse profiles by assuming a uniform cylindrical geometry. The typical critical volume densities lie beyond the plot, at ≳ 3 × 105 cm−3.
. Bottom: distribution of the volume density of the filaments, derived from the linear density and the FWHM of the transverse profiles by assuming a uniform cylindrical geometry. The typical critical volume densities lie beyond the plot, at ≳ 3 × 105 cm−3.
Current usage metrics show cumulative count of Article Views (full-text article views including HTML views, PDF and ePub downloads, according to the available data) and Abstracts Views on Vision4Press platform.
Data correspond to usage on the plateform after 2015. The current usage metrics is available 48-96 hours after online publication and is updated daily on week days.
Initial download of the metrics may take a while.