Fig. 10
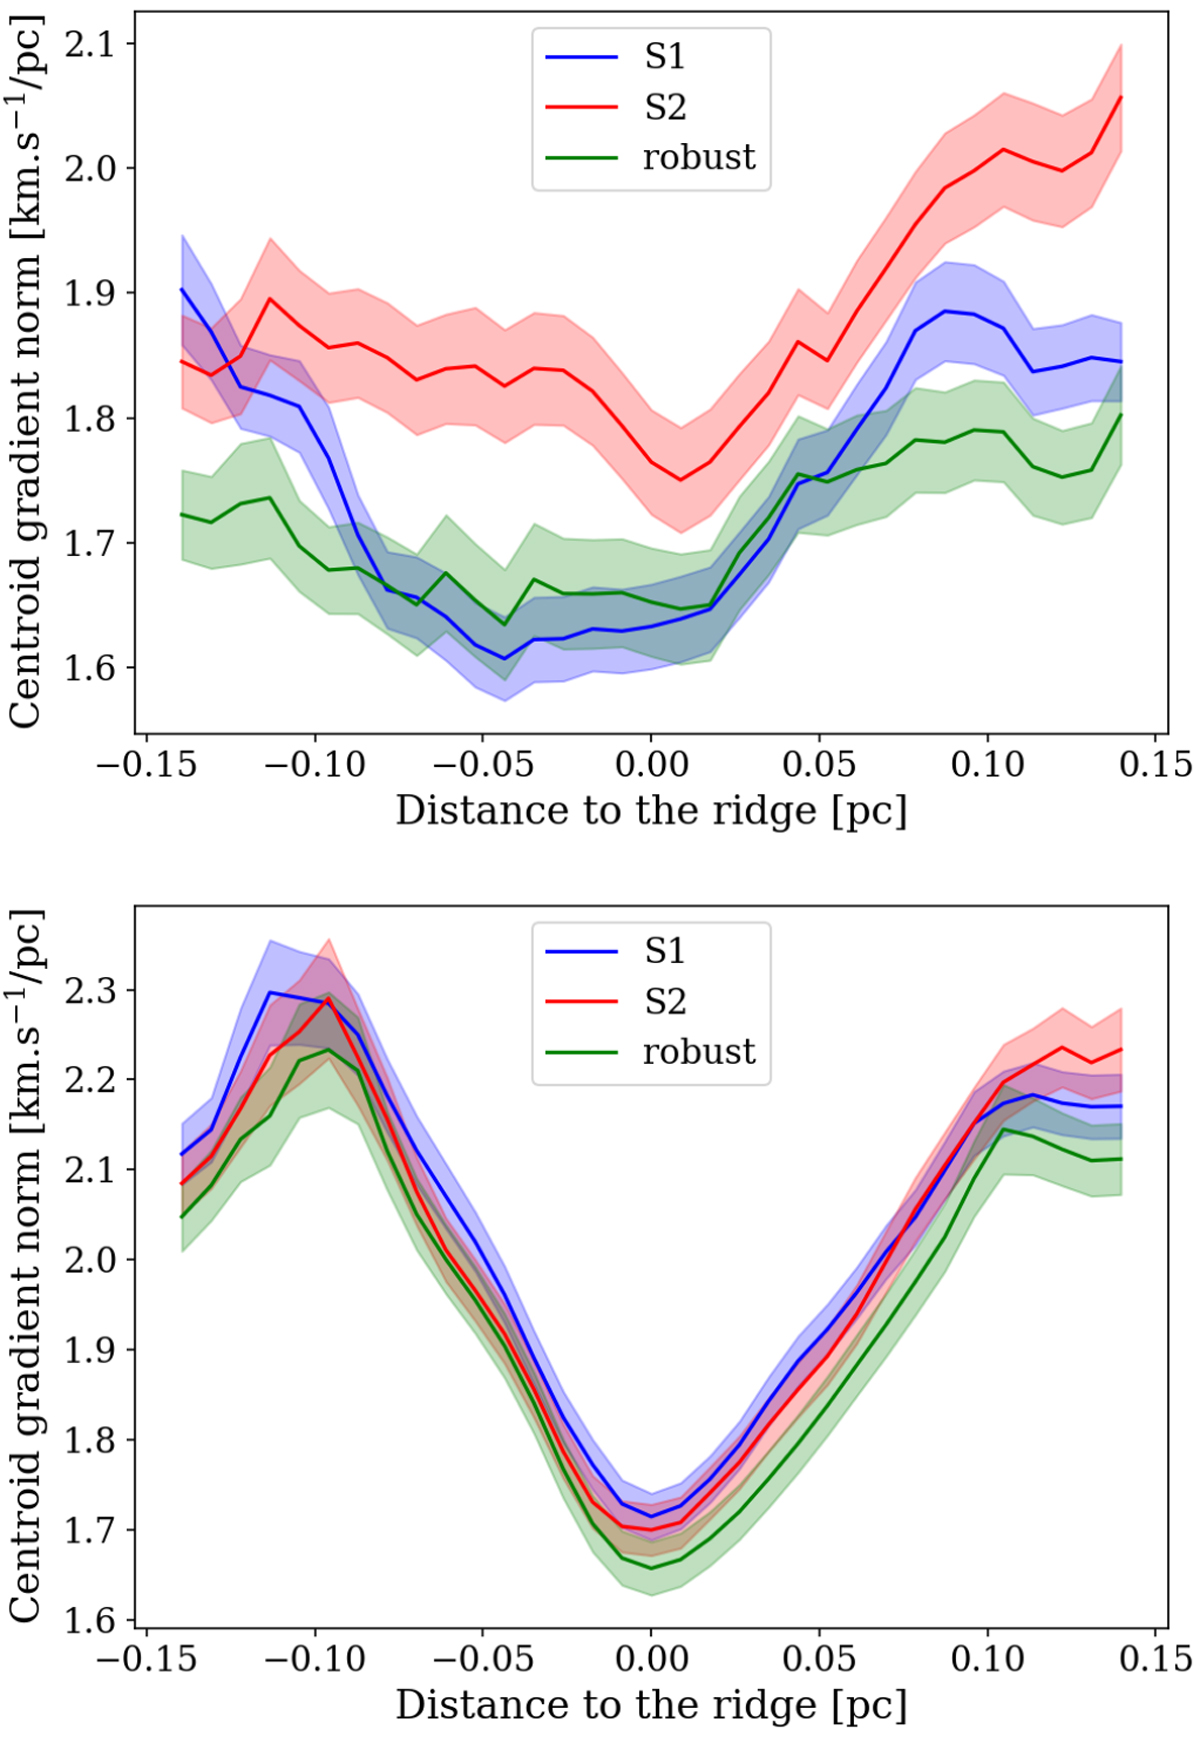
Top: average transverse profiles of the amplitude of the centroid velocity gradient of the filaments. These profiles are computed for the S1, S2, and robust skeletons via the C18O (J = 1−0) data cube; the shaded areas show the standard error for each profile. Bottom: same as above, but using the 13CO (J = 1−0) data cube for comparison.
Current usage metrics show cumulative count of Article Views (full-text article views including HTML views, PDF and ePub downloads, according to the available data) and Abstracts Views on Vision4Press platform.
Data correspond to usage on the plateform after 2015. The current usage metrics is available 48-96 hours after online publication and is updated daily on week days.
Initial download of the metrics may take a while.