Fig. 9
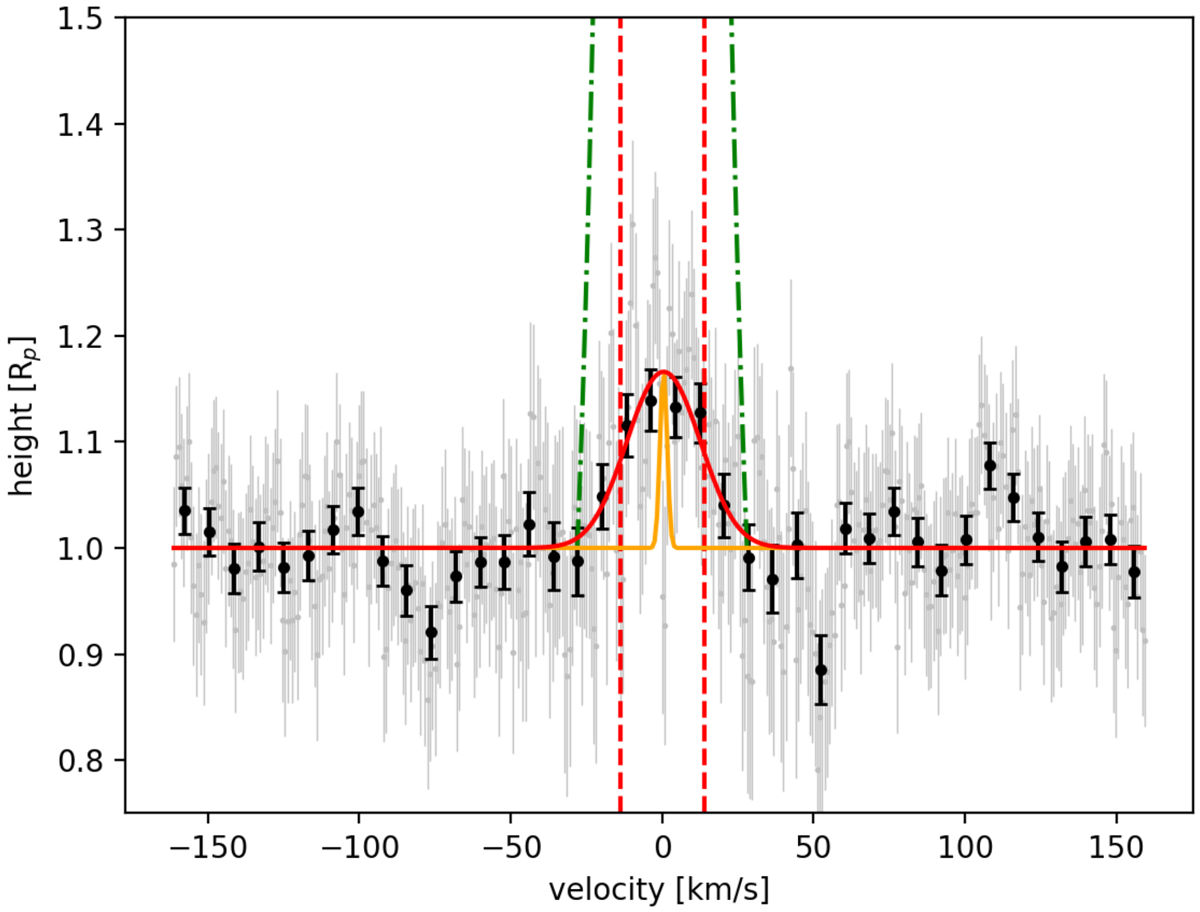
Co-added lines of the HARPS transmission spectrum sodium doublet as a function of velocity. The line centre was set to zero. The data are shown in grey and binned × 10 in black. A Gaussian fit derived as in Sect. 4.2 is shown in red with its FWHM marked by the red dashed lines. The HARPS instrumental line spread function (FWHM = 2.7 km s−1) is shown in orange and the escape velocity as green dotted-dashed lines. The FWHM velocity does not exceed the escape velocity at any point, making the atmospheric escape of sodium unlikely. The best Gaussian fit to the data is significantly wider than the instrumental response, but the corresponding velocity is well below the escape velocity of WASP-76b. Given that the conversion of relative depth to height depends on the choice of height at the continuum level (here: WASP-76b white light radius), the height is not an absolute height but an equivalence height (Pino et al. 2018b).
Current usage metrics show cumulative count of Article Views (full-text article views including HTML views, PDF and ePub downloads, according to the available data) and Abstracts Views on Vision4Press platform.
Data correspond to usage on the plateform after 2015. The current usage metrics is available 48-96 hours after online publication and is updated daily on week days.
Initial download of the metrics may take a while.