Fig. 8
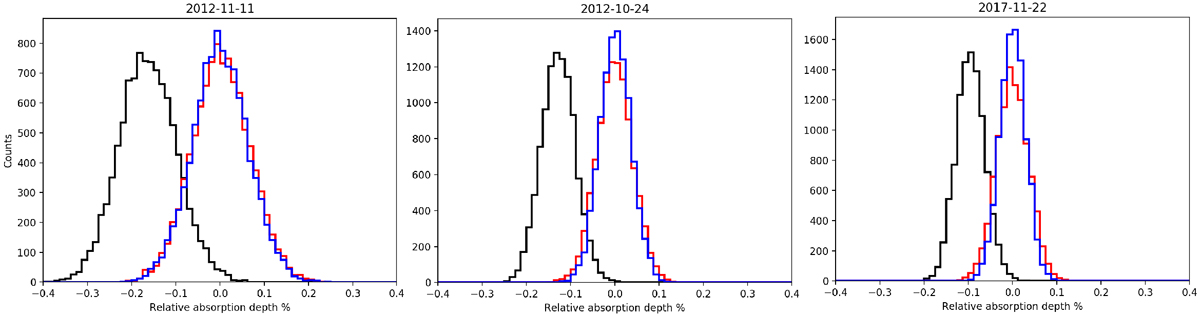
Distributions of the EMC analysis for the 12 Å passband. The resultsfor the transmission spectrum method are shown. As expected the “in–in” (red) and “out–out” (blue) distributions are centred around zero (no planetary detection) and the randomised “in–out” distribution shows a detection (black). On each night a different number of spectra was taken, which means that each randomisation will give a different number of counts, which results in a different scaling on the y-axis. This has no influence on the overall result.
Current usage metrics show cumulative count of Article Views (full-text article views including HTML views, PDF and ePub downloads, according to the available data) and Abstracts Views on Vision4Press platform.
Data correspond to usage on the plateform after 2015. The current usage metrics is available 48-96 hours after online publication and is updated daily on week days.
Initial download of the metrics may take a while.