Fig. 7
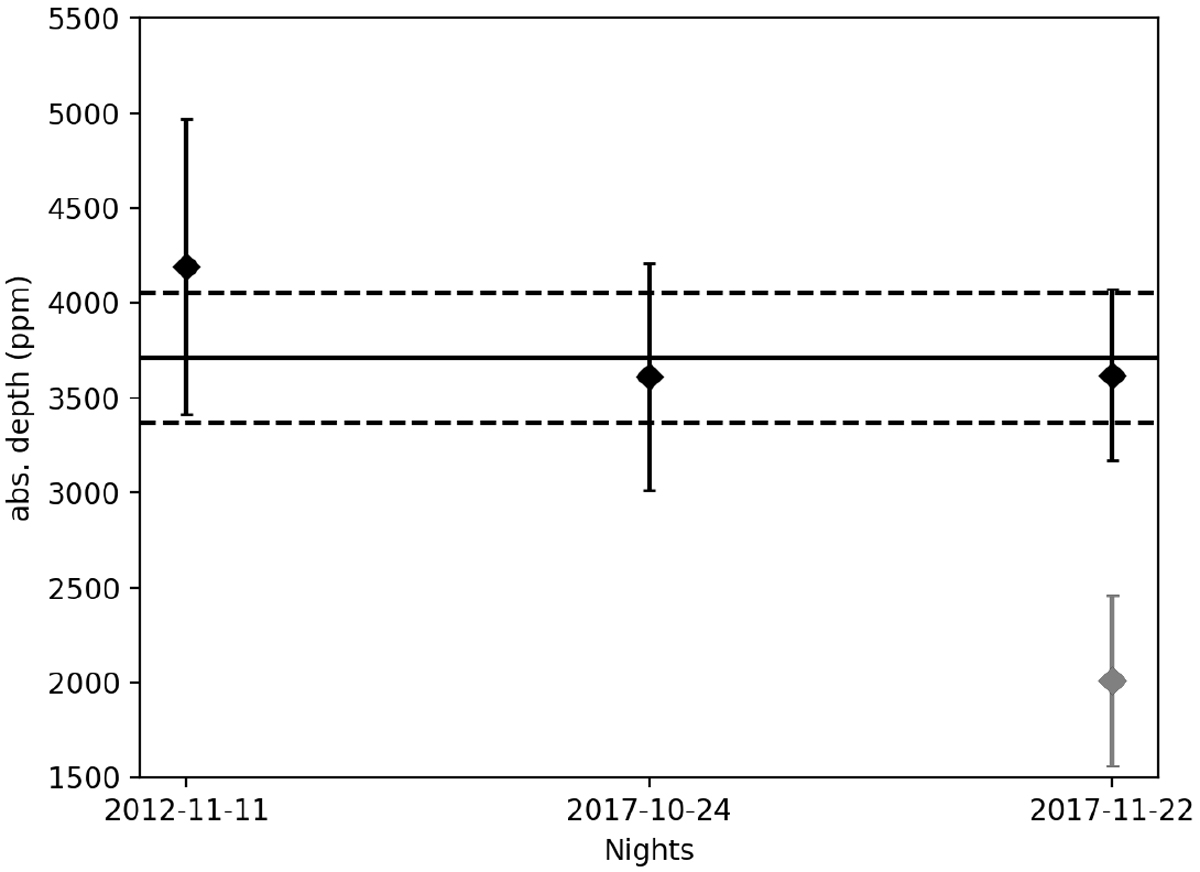
Absorption depth of the three nights calculated from the transmission spectrum of the sodium doublet plotted with the value for all nights together and highlighted as a black horizontal line. The dashed lines mark one sigma around the main absorption depth. The data point in grey shows the value calculated for Night 3 when the cloud-contaminated exposures are not discarded. All values were taken from Tables 7 and 6.
Current usage metrics show cumulative count of Article Views (full-text article views including HTML views, PDF and ePub downloads, according to the available data) and Abstracts Views on Vision4Press platform.
Data correspond to usage on the plateform after 2015. The current usage metrics is available 48-96 hours after online publication and is updated daily on week days.
Initial download of the metrics may take a while.