Fig. 5
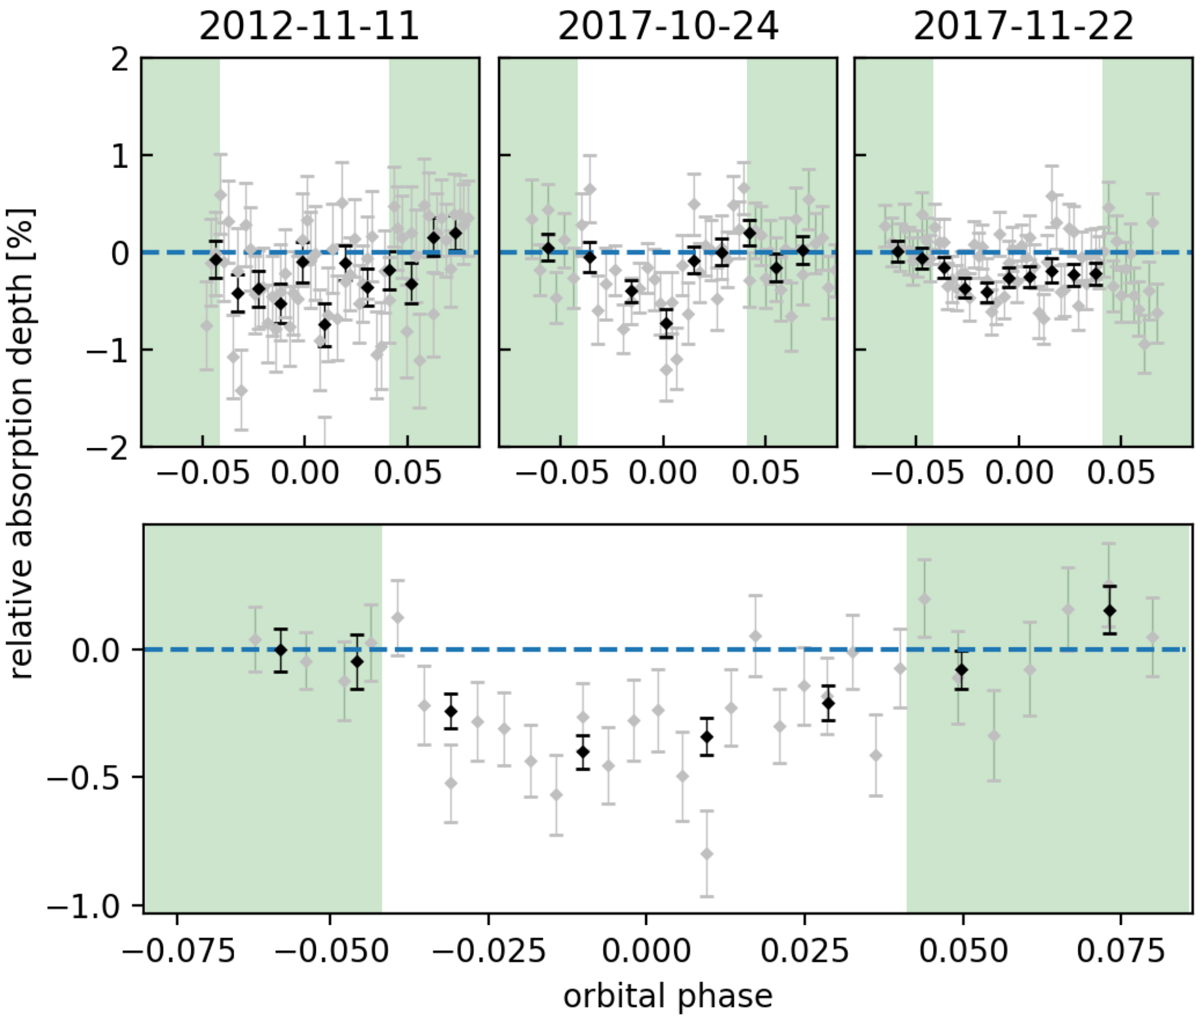
HARPS relative excess absorption in the sodium doublet compared to the white light curve of WASP-76b evolving in time. The upper three plots show the light curves for each night 2012-11-11, 2017-10-24, and 2017-11-22 from left to right. We note the different scales on the ordinate axis for upper and lower panels and the influence of stratus clouds in the out-of-transit exposures during the night of 2017-11-22. The grey data points show the relative absorption for each exposure; inblack the data is binned by five spectra. Lower panel: light curve for all three nights combined, with the original exposures averaged together for five spectra each in grey and binned by five averaged spectra in grey. The green background marks the exposures taken out-of-transit.
Current usage metrics show cumulative count of Article Views (full-text article views including HTML views, PDF and ePub downloads, according to the available data) and Abstracts Views on Vision4Press platform.
Data correspond to usage on the plateform after 2015. The current usage metrics is available 48-96 hours after online publication and is updated daily on week days.
Initial download of the metrics may take a while.