Fig. 4.
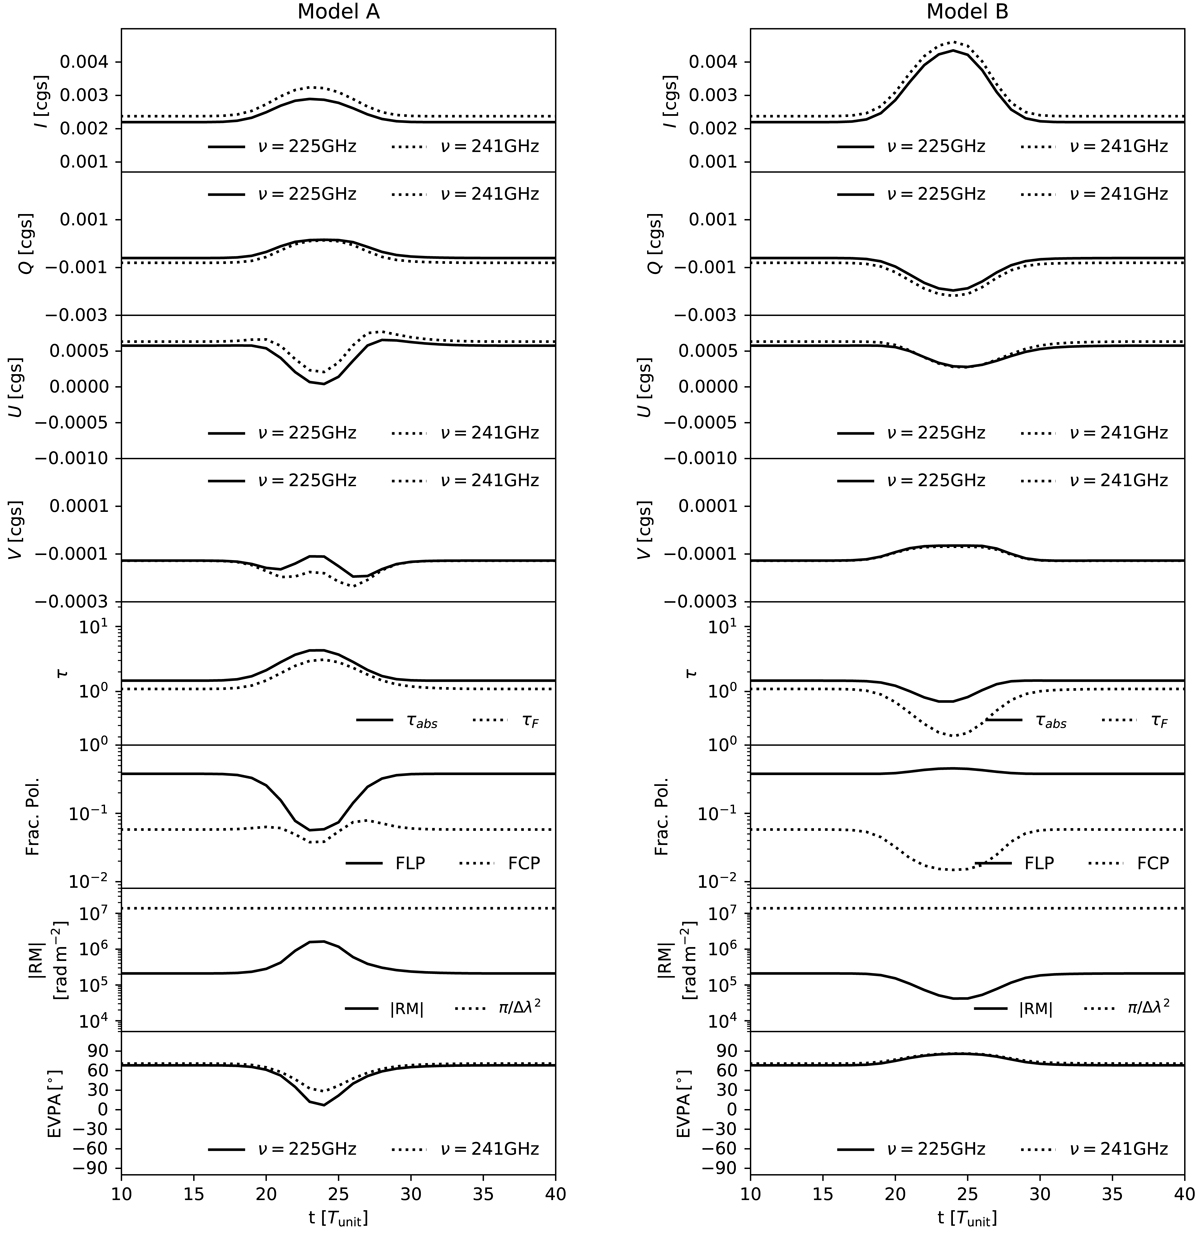
Light curves of the Stokes parameters and the secondary polarimetric quantities computed with a dense plasmoid (Model A: left column) and with a hot plasmoid component (Model B: right column) moving along with the background flow (see Sect. 3.2 for the model descriptions). In both models the plasmoid is injected into the computational domain at t ≈ 4.2Tunit and it reaches the position where we make a measurement at t ≈ 31.3Tunit. The four upper panels show the model light curves of the Stokes parameters (I, Q, U, V), and the four lower panels show the corresponding time evolution of the optical and Faraday depths (τabs and τF: fifth row), the fractional linear and circular polarizations (FLP and FCP: sixth row), the rotation measure (RM: seventh row), and the electric vector position angle (EVPA; eighth row). The Stokes parameters and EVPA are computed at the two frequencies (ν = 225 GHz and 241 GHz). The other polarimetric quantities are computed around the synchrotron peak frequency (Fig. 2). In the plot for RM, the maximum possible RM value (π/Δλ2) is the maximum RM that can be resolved within the chosen frequency range.
Current usage metrics show cumulative count of Article Views (full-text article views including HTML views, PDF and ePub downloads, according to the available data) and Abstracts Views on Vision4Press platform.
Data correspond to usage on the plateform after 2015. The current usage metrics is available 48-96 hours after online publication and is updated daily on week days.
Initial download of the metrics may take a while.