Fig. 3.
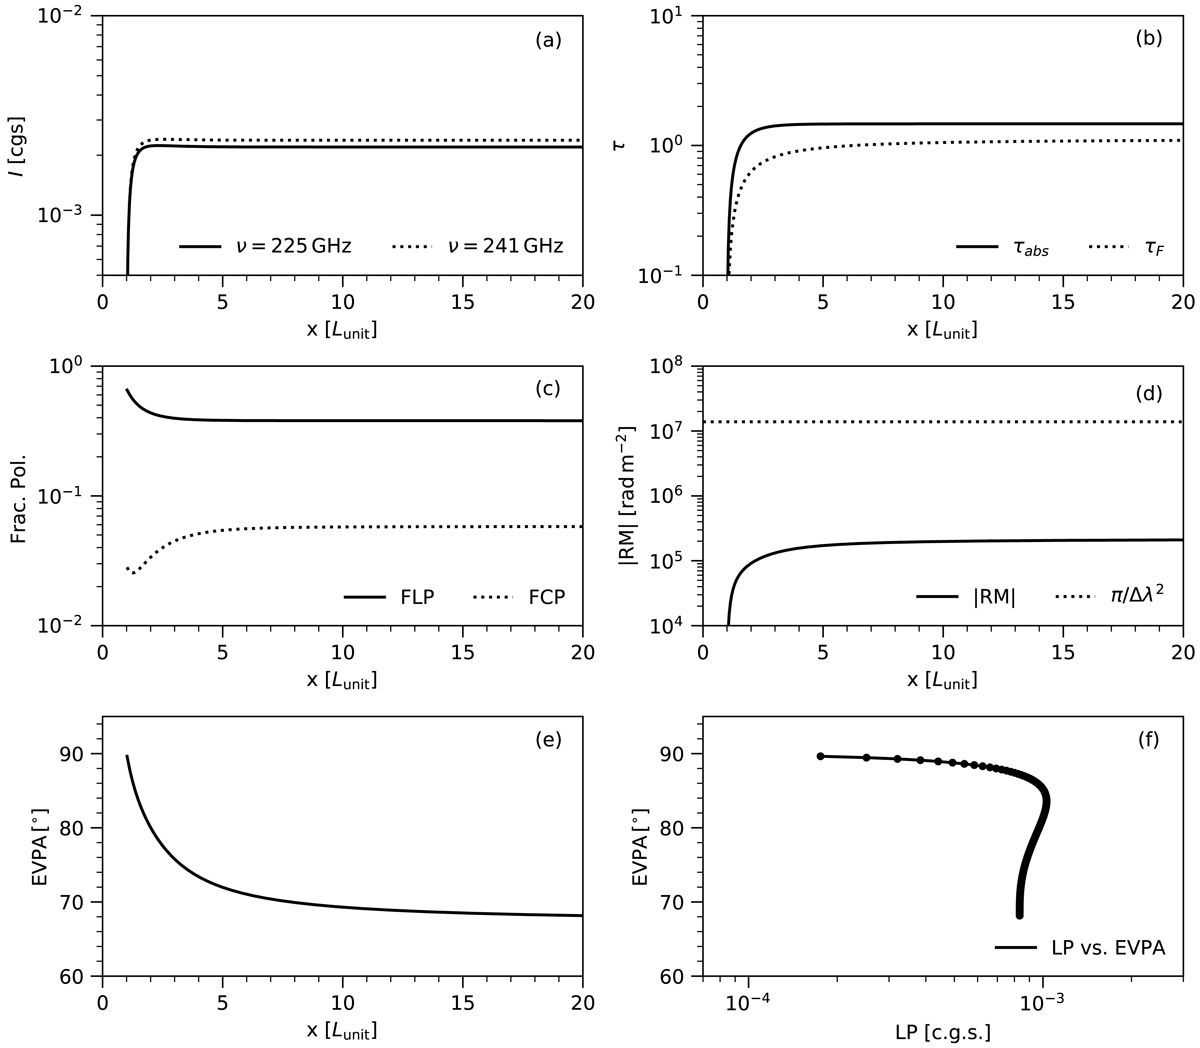
Changes in polarimetric quantities along the integration path in the static background jet component model. The calculations are performed for photons at ν = 230 GHz, which corresponds to τ ≈ 1 in the SED plot (left panel of Fig. 2). Shown are the following quantities: panel a: Stokes I (where I ≡ Iν is the specific intensity in cgs units [ergss−1 cm−2ster−1Hz−1]); panel b: optical and Faraday depths (τabs and τF), where τF = ∫ρVdl; panel c: fractional linear and circular polarization (FLP and FCP), where ![]() and FCP = V/I (here we show absolute values, not percentages); panel d: rotation measure
and FCP = V/I (here we show absolute values, not percentages); panel d: rotation measure ![]() (here we show absolute value); panel e: electric vector position angle EVPA = arg(Q + iU)/2; and panel f: EVPA plotted as a function of linearly polarized flux
(here we show absolute value); panel e: electric vector position angle EVPA = arg(Q + iU)/2; and panel f: EVPA plotted as a function of linearly polarized flux ![]() . The spectra shown in Fig. 2 (left panel) are measured at x = 20 Lunit.
. The spectra shown in Fig. 2 (left panel) are measured at x = 20 Lunit.
Current usage metrics show cumulative count of Article Views (full-text article views including HTML views, PDF and ePub downloads, according to the available data) and Abstracts Views on Vision4Press platform.
Data correspond to usage on the plateform after 2015. The current usage metrics is available 48-96 hours after online publication and is updated daily on week days.
Initial download of the metrics may take a while.