Free Access
Fig. 4.
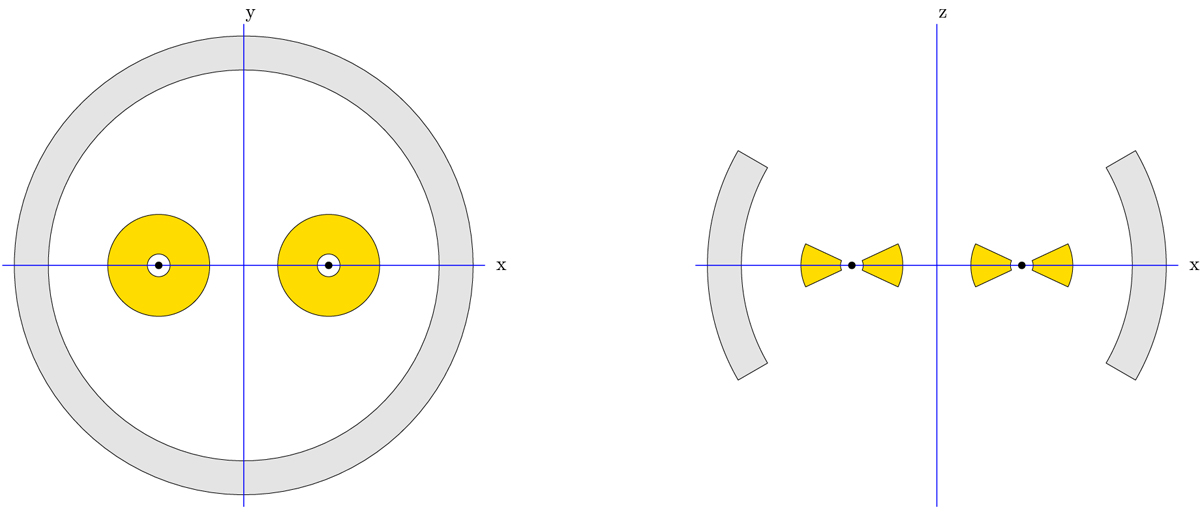
Cartoon illustrating equatorial scattering region. The left figure shows the face-on view, while on the right the same geometry is shown when viewed edge-on. An example is shown for the case in which the two BLRs are separated. The BLRs are shown in yellow. The scattering region is shown in gray.
Current usage metrics show cumulative count of Article Views (full-text article views including HTML views, PDF and ePub downloads, according to the available data) and Abstracts Views on Vision4Press platform.
Data correspond to usage on the plateform after 2015. The current usage metrics is available 48-96 hours after online publication and is updated daily on week days.
Initial download of the metrics may take a while.