Fig. 6
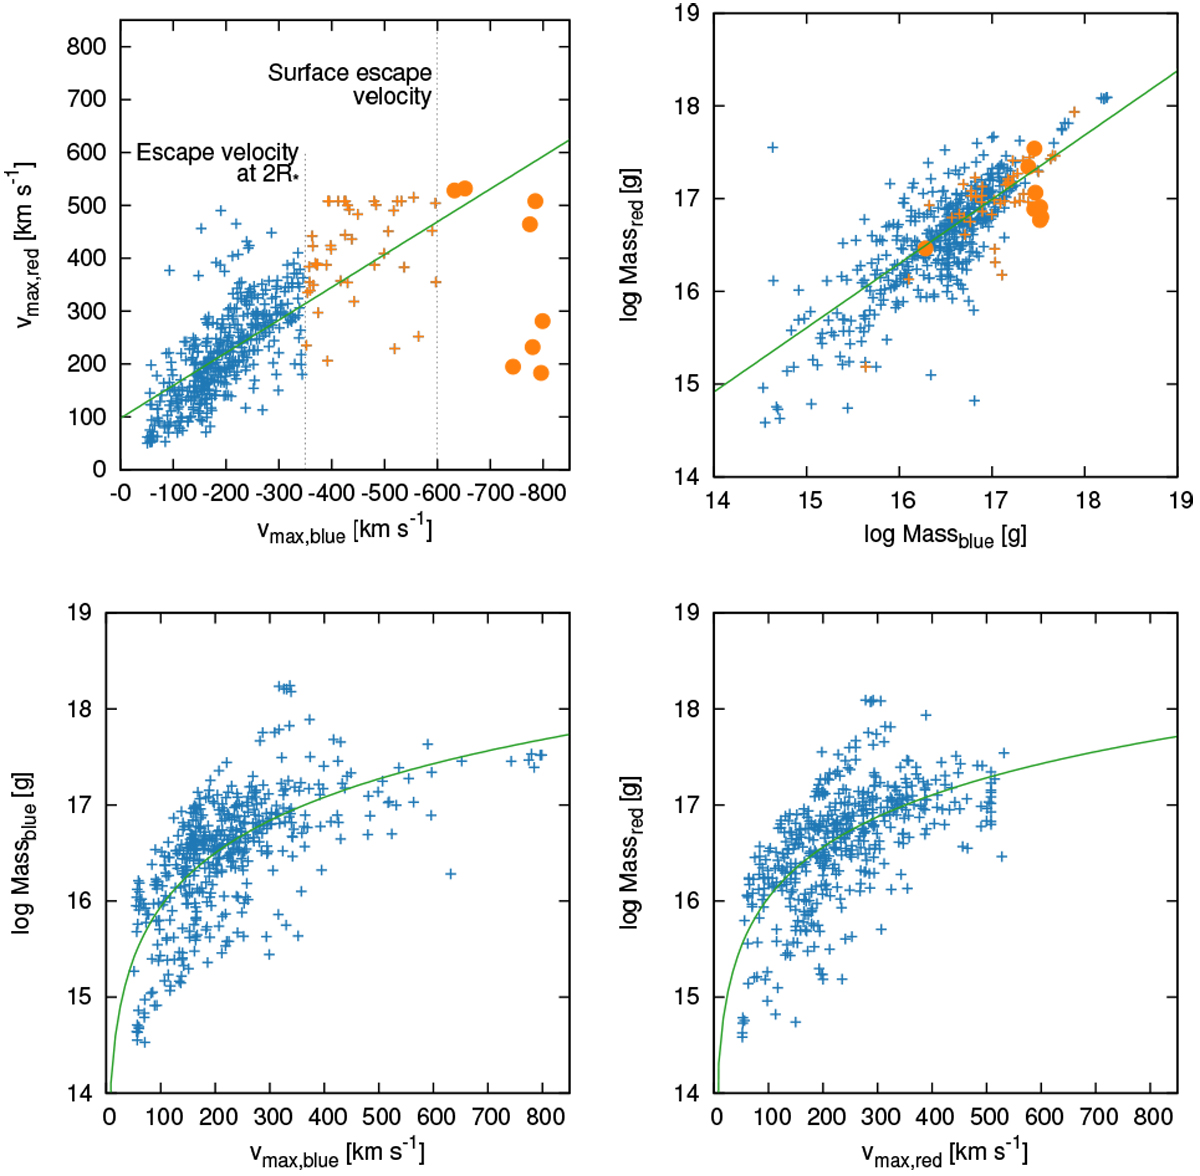
Top row: velocities and masses derived from blue vs. red enhancements. On the left plot, vertical lines mark the approximate escape velocity on M dwarfs at the surface and at two stellar radii, events with higher speed are marked with different colours on both plots. Lines show linear fits to the data. Bottom row: relation between maximum velocities and estimated masses.
Current usage metrics show cumulative count of Article Views (full-text article views including HTML views, PDF and ePub downloads, according to the available data) and Abstracts Views on Vision4Press platform.
Data correspond to usage on the plateform after 2015. The current usage metrics is available 48-96 hours after online publication and is updated daily on week days.
Initial download of the metrics may take a while.