Fig. 5
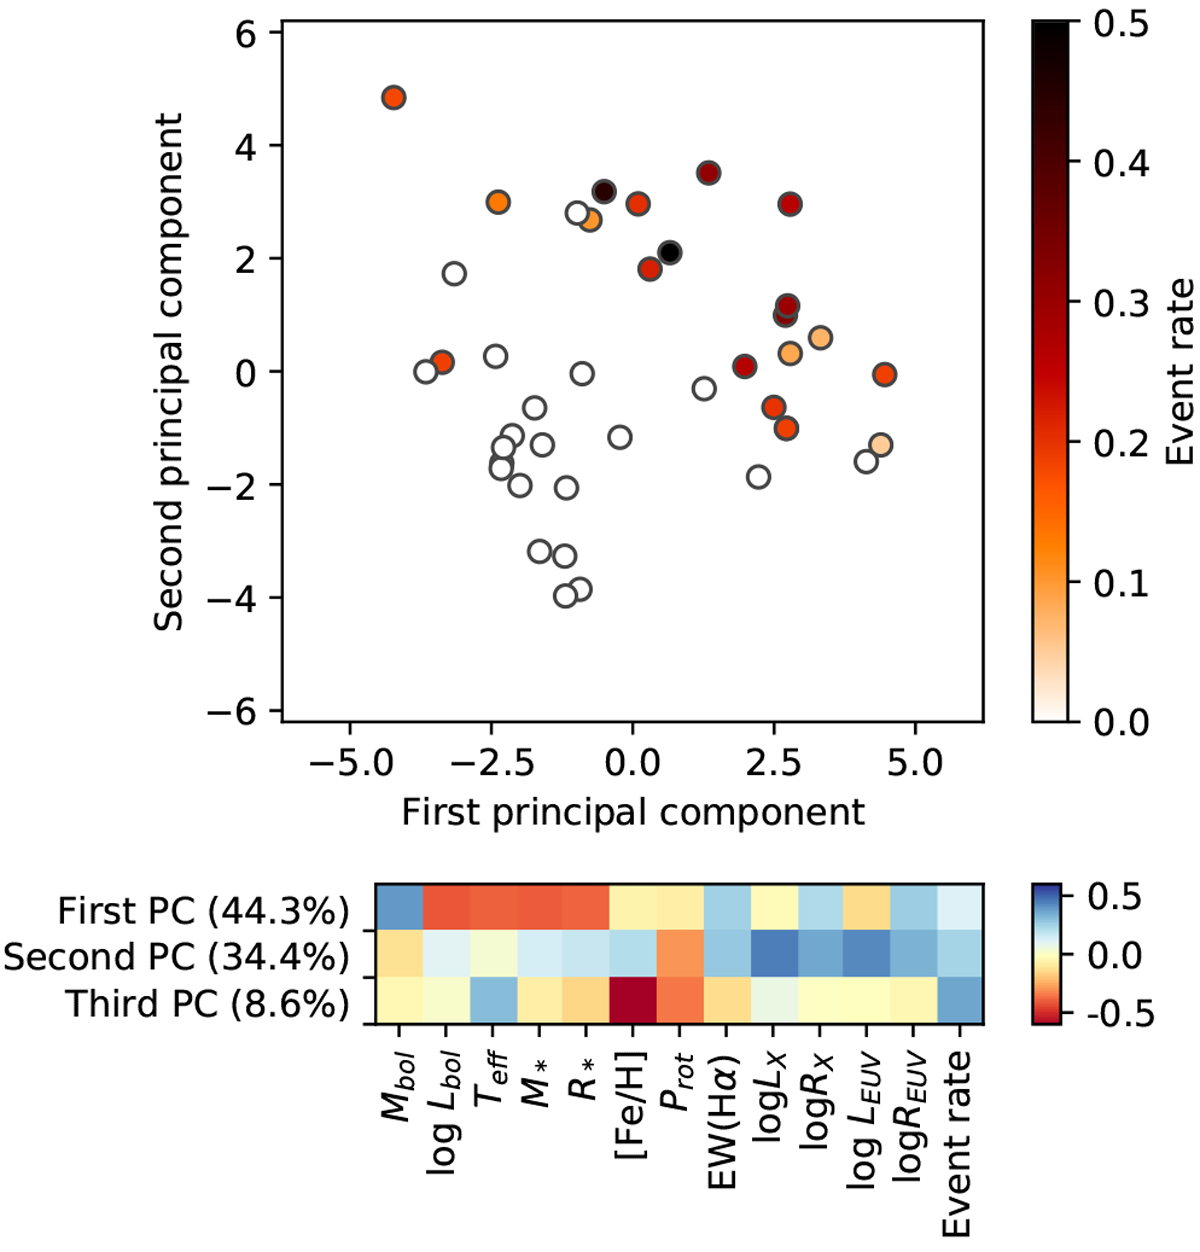
Result of the principal component analysis (PCA). Top plot: the data plotted along the first and second principal components. Objects with detected line asymmetries are plotted with filled circles, their shade corresponds to the measured event rate. Bottom plot: the coefficients for the first three principal components (PCs). The main features of the first PC are related mainly to stellar structure, while the features in the second PC are mainly related to EUV and X-ray activity indices.
Current usage metrics show cumulative count of Article Views (full-text article views including HTML views, PDF and ePub downloads, according to the available data) and Abstracts Views on Vision4Press platform.
Data correspond to usage on the plateform after 2015. The current usage metrics is available 48-96 hours after online publication and is updated daily on week days.
Initial download of the metrics may take a while.