Fig. 3
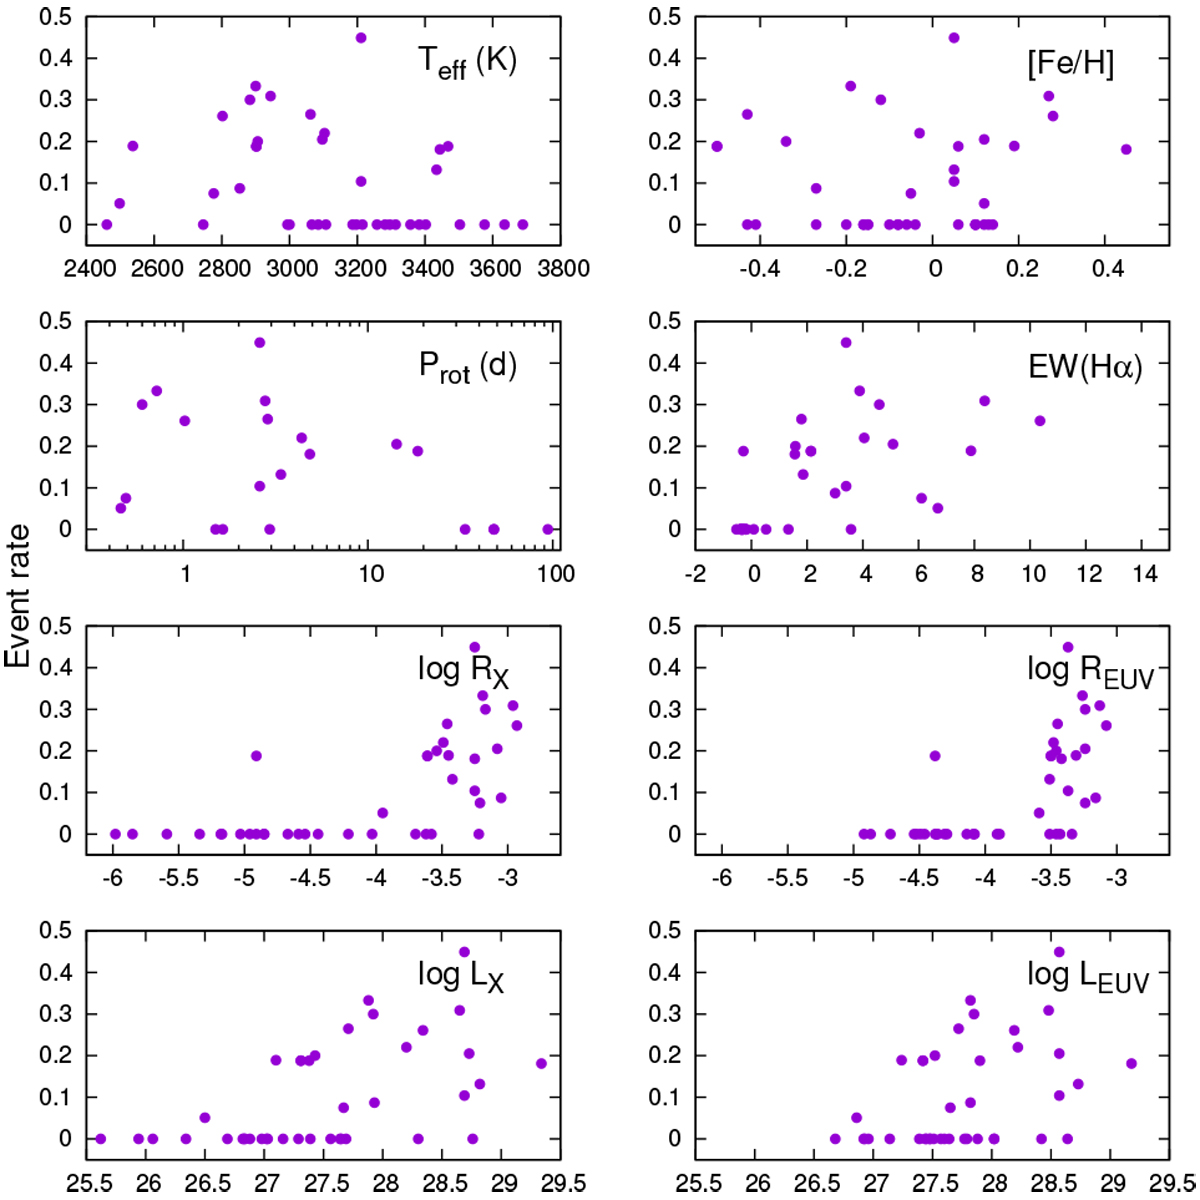
Line asymmetry rates vs. different physical parameters. EW(Hα), log RX and log REUV denote Hα equivalent width (in Angstroms), and X-ray/EUV activity indices, respectively. log LX and log LEUV plots are in erg s−1 units. Note, that for some objects, some information is missing (e.g. Prot), thus not all subplots contain the same number of points.
Current usage metrics show cumulative count of Article Views (full-text article views including HTML views, PDF and ePub downloads, according to the available data) and Abstracts Views on Vision4Press platform.
Data correspond to usage on the plateform after 2015. The current usage metrics is available 48-96 hours after online publication and is updated daily on week days.
Initial download of the metrics may take a while.