Fig. 2
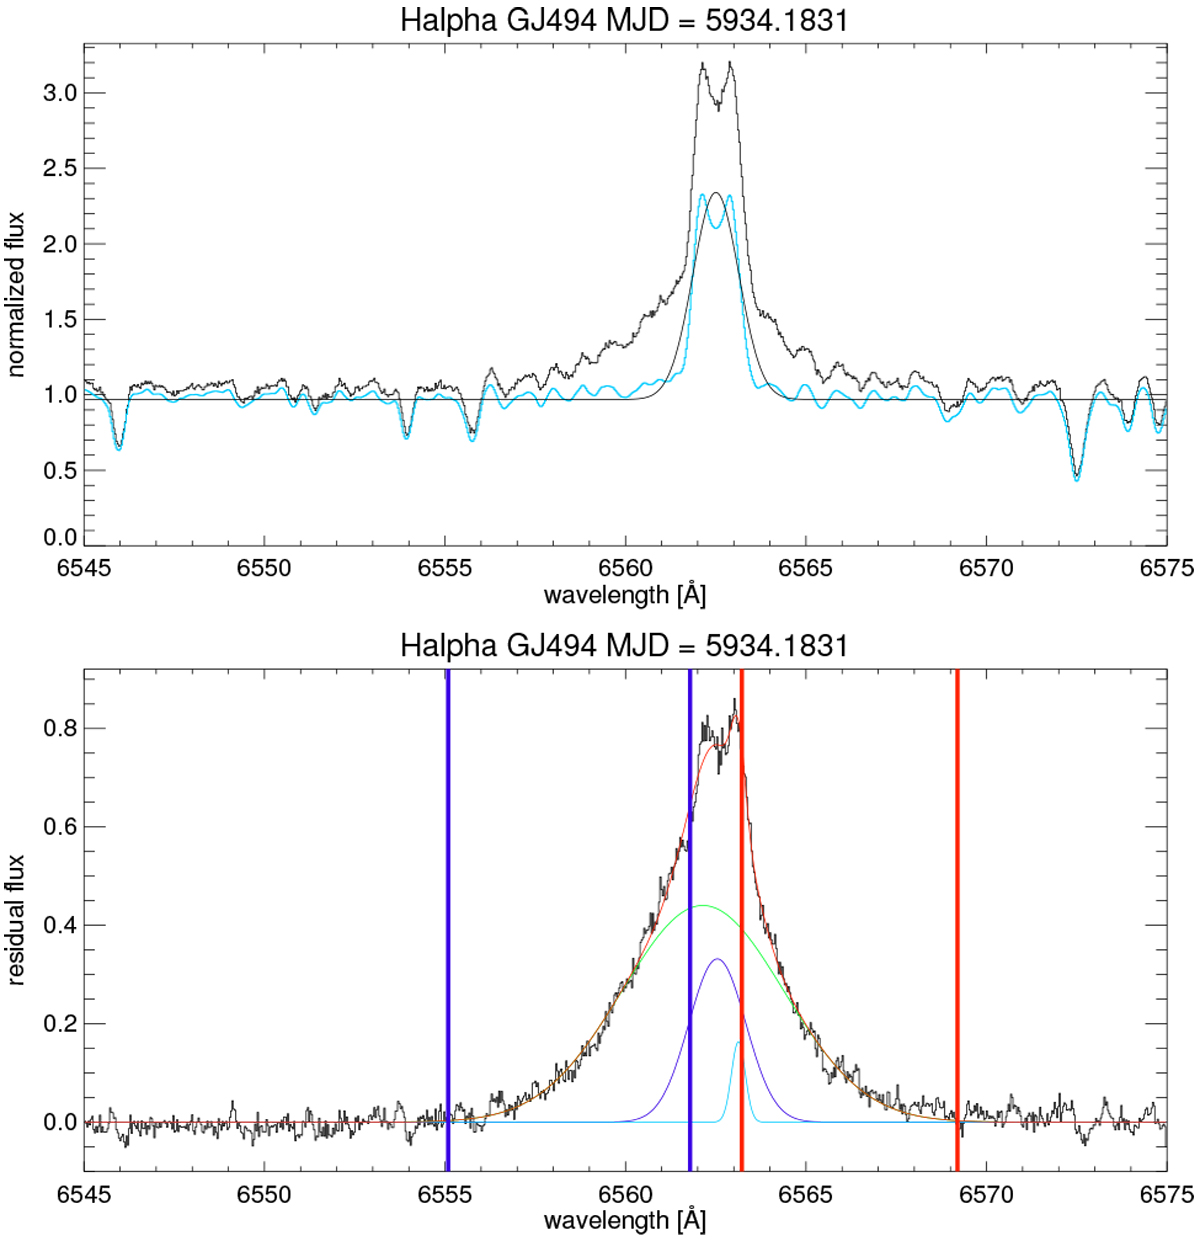
Upper panel: average (quiescent) spectrum of GJ494 (cyan line) and an example of an active spectrum (black line). Overplotted is the fit (one Gaussian) of the quiescent spectrum. Lower panel: residual spectrum (black line) of the event from the upper panel. The fit of the residual profile (red line) together with the single components (green, blue, and cyan lines) are also plotted. The red and blue vertical solid lines correspond to the integration limits which are used for the determination of the flux of the red and blue asymmetries.
Current usage metrics show cumulative count of Article Views (full-text article views including HTML views, PDF and ePub downloads, according to the available data) and Abstracts Views on Vision4Press platform.
Data correspond to usage on the plateform after 2015. The current usage metrics is available 48-96 hours after online publication and is updated daily on week days.
Initial download of the metrics may take a while.