Fig. 9.
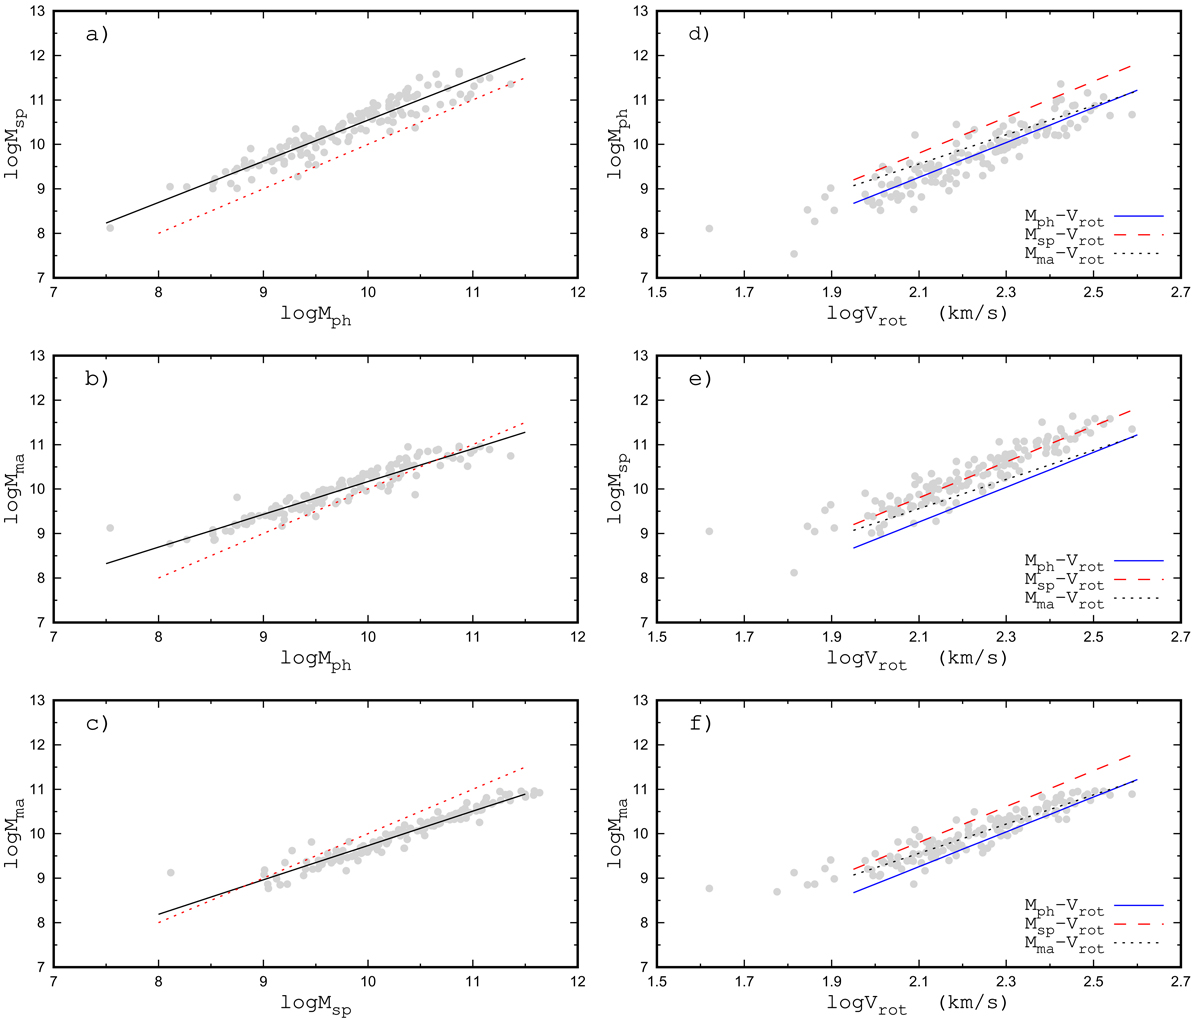
Panel a: spectroscopic stellar mass of our galaxies, Msp, as a function of their photometric stellar mass, Mph. The points represent the individual MaNGA galaxies of our sample. The solid line is the linear best fit to those points. The dotted line indicates exact correpondence in the masses. Panel b: MaNGA stellar mass, Mma, as a function of photometric stellar mass, Mph, and panel c: MaNGA stellar mass, Mma, as a function of spectroscopic stellar mass Msp. The notations are the same as in panel a. Panels d–f: Mph, Msp, and Mma as a function of the rotation velocity Vrot, respectively. The points denote individual galaxies, the solid line is the Mph–Vrot relation (best fit), the long-dashed line is the Msp–Vrot relation, and the short-dashed line is the Mma–Vrot relation.
Current usage metrics show cumulative count of Article Views (full-text article views including HTML views, PDF and ePub downloads, according to the available data) and Abstracts Views on Vision4Press platform.
Data correspond to usage on the plateform after 2015. The current usage metrics is available 48-96 hours after online publication and is updated daily on week days.
Initial download of the metrics may take a while.