Fig. 8.
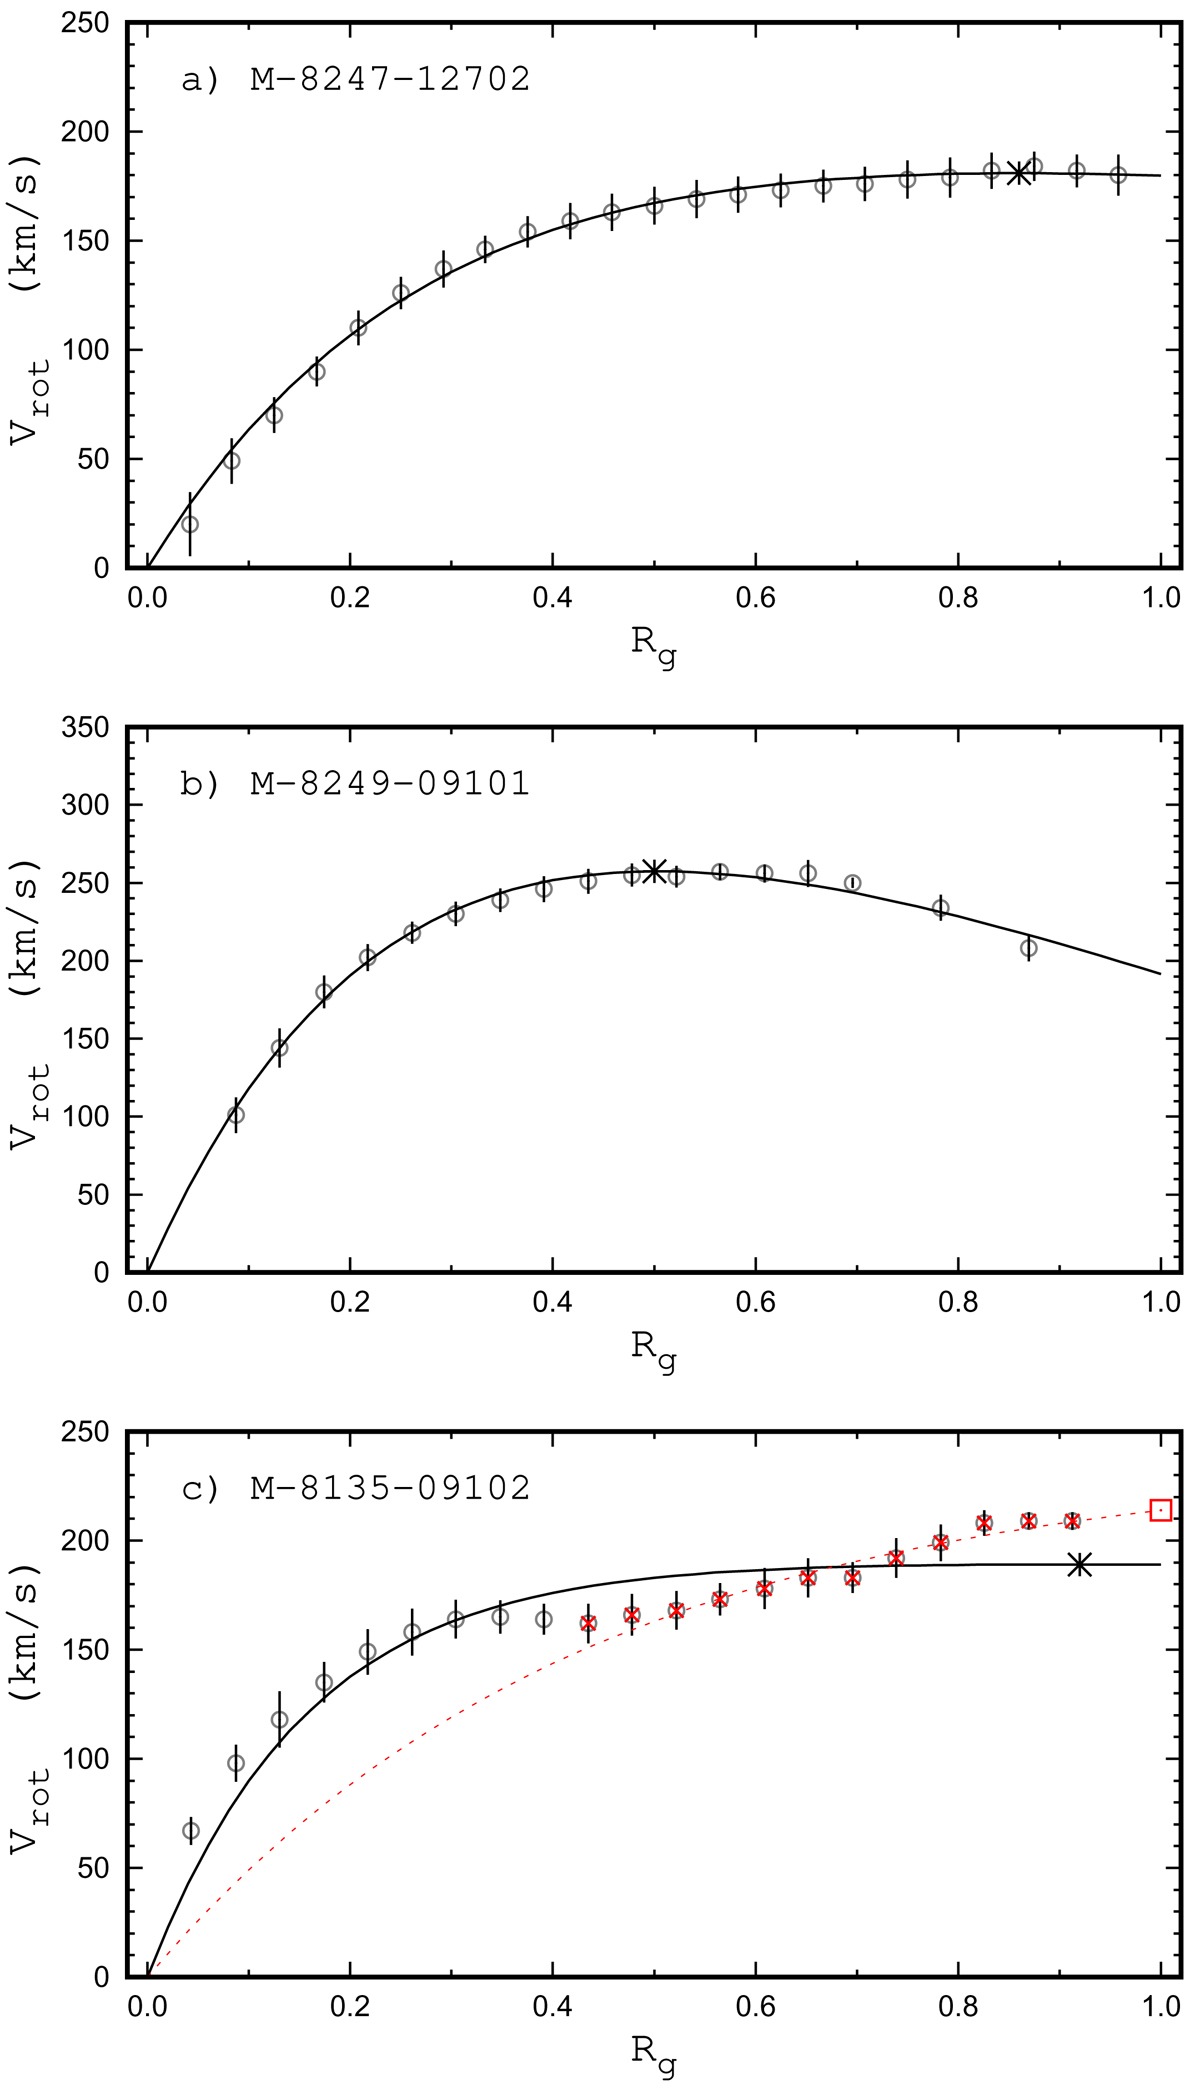
Obtained rotation curve and fit with a Polyex curve for three MaNGA galaxies. Rg is the fractional radius (normalized to the optical radius R25). In each panel, the obtained rotation curve is represented by grey circles. The bars indicate the mean scatter of the spaxel rotation velocities in rings of 1 pixel width. The solid line is the fit with a Polyex curve. The asterisk is the maximum value of the rotation velocity in the rotation curve fit within the optical radius. In panel c, the Polyex curve fit to the outer part of the rotation curve (points marked with red crosses) is presented by a dashed line and the corresponding maximum value of the rotation velocity is indicated by a square.
Current usage metrics show cumulative count of Article Views (full-text article views including HTML views, PDF and ePub downloads, according to the available data) and Abstracts Views on Vision4Press platform.
Data correspond to usage on the plateform after 2015. The current usage metrics is available 48-96 hours after online publication and is updated daily on week days.
Initial download of the metrics may take a while.