Fig. 6.
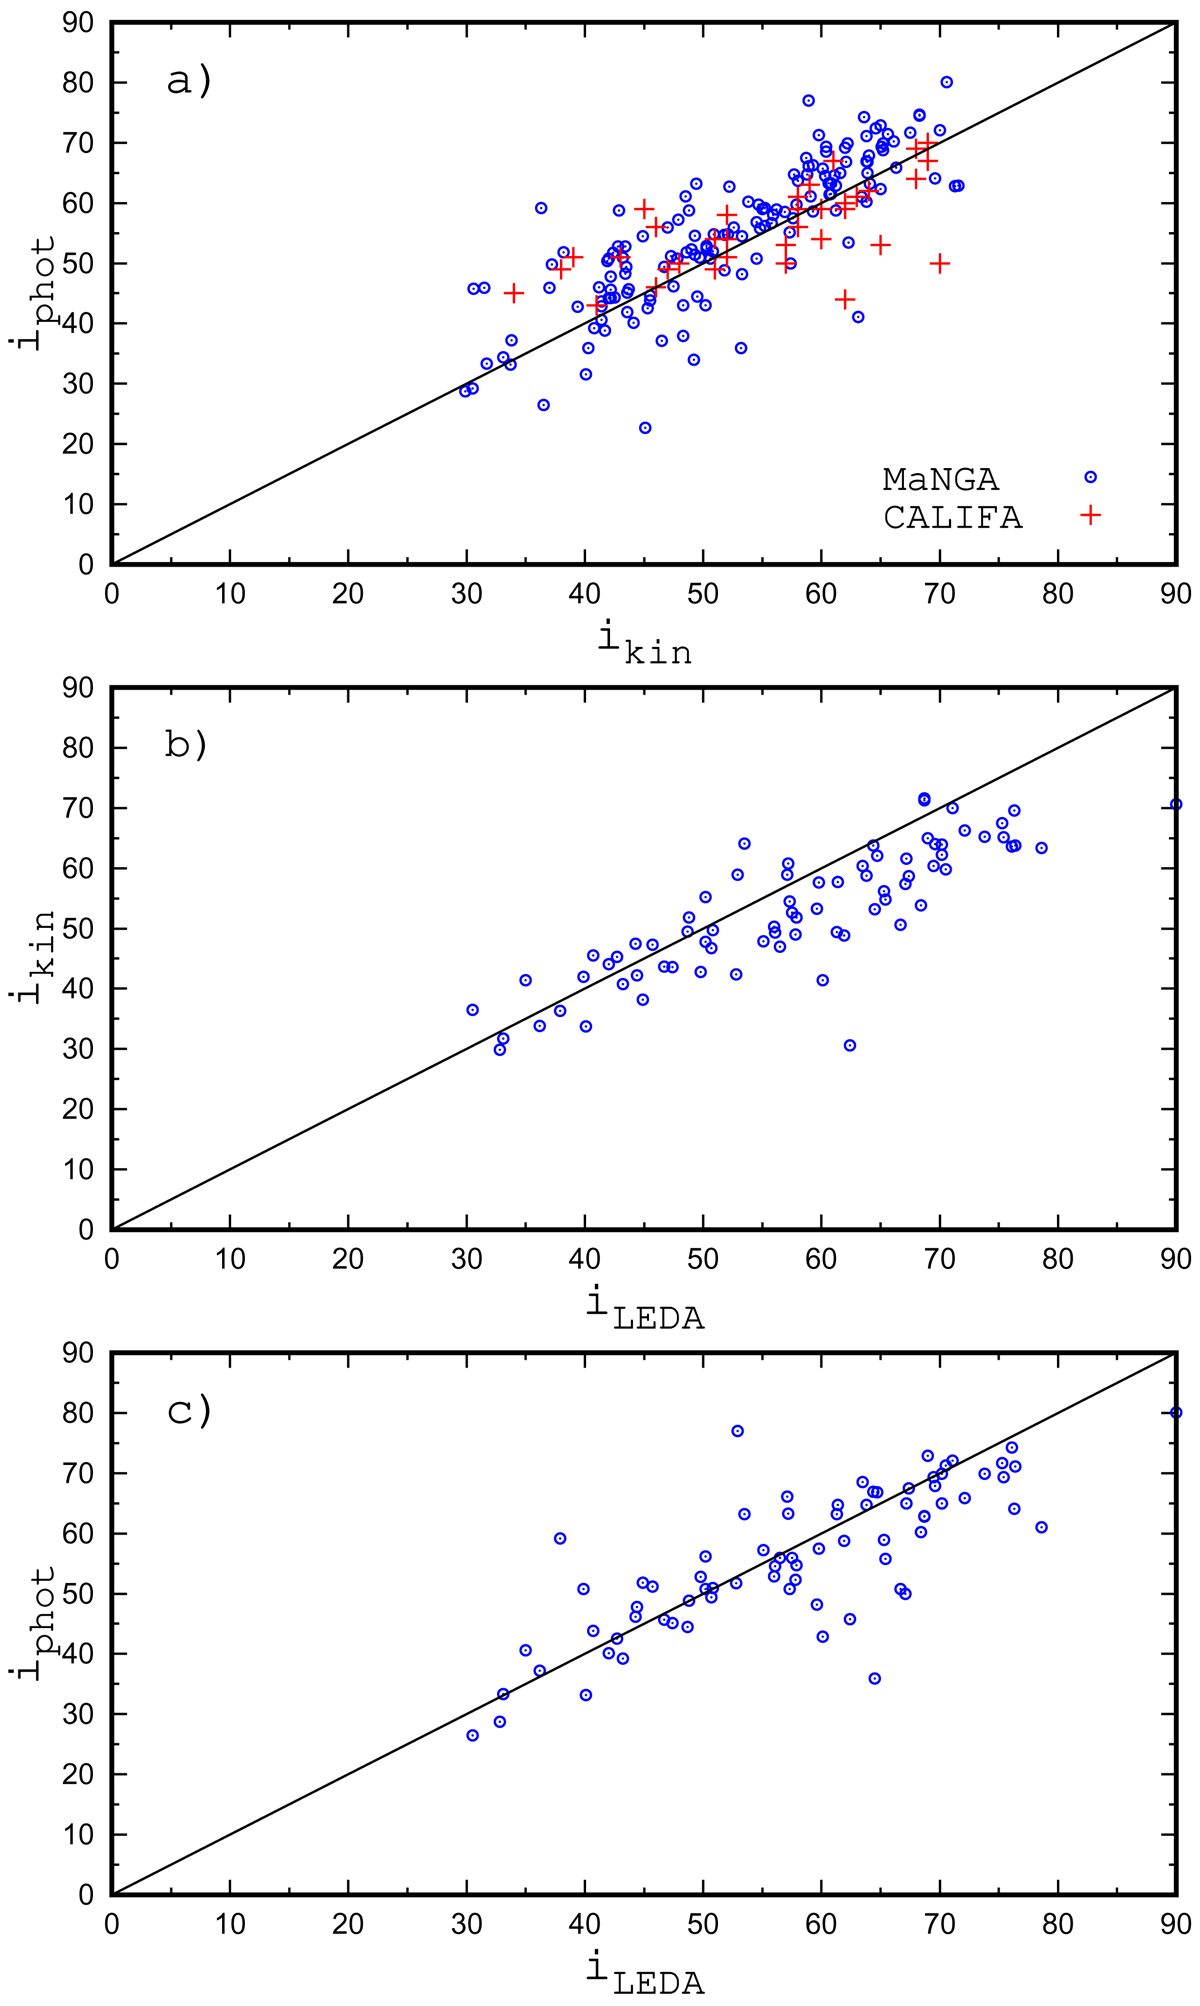
Panel a: comparison between the values of the inclination angle obtained from the analysis of the velocity fields, ikin, and from the analysis of the photometric maps, iphot, for our sample of MaNGA galaxies. The points stand for individual galaxies. The line indicates unity. The plus signs indicate data for CALIFA galaxies from Holmes et al. (2015). Panel b: comparison between the kinematic inclination angles derived here and the inclination angles from the HyperLeda database. Panel c: comparison between the photometric inclination angles derived here and the inclination angles from the HyperLeda database.
Current usage metrics show cumulative count of Article Views (full-text article views including HTML views, PDF and ePub downloads, according to the available data) and Abstracts Views on Vision4Press platform.
Data correspond to usage on the plateform after 2015. The current usage metrics is available 48-96 hours after online publication and is updated daily on week days.
Initial download of the metrics may take a while.