Fig. 4.
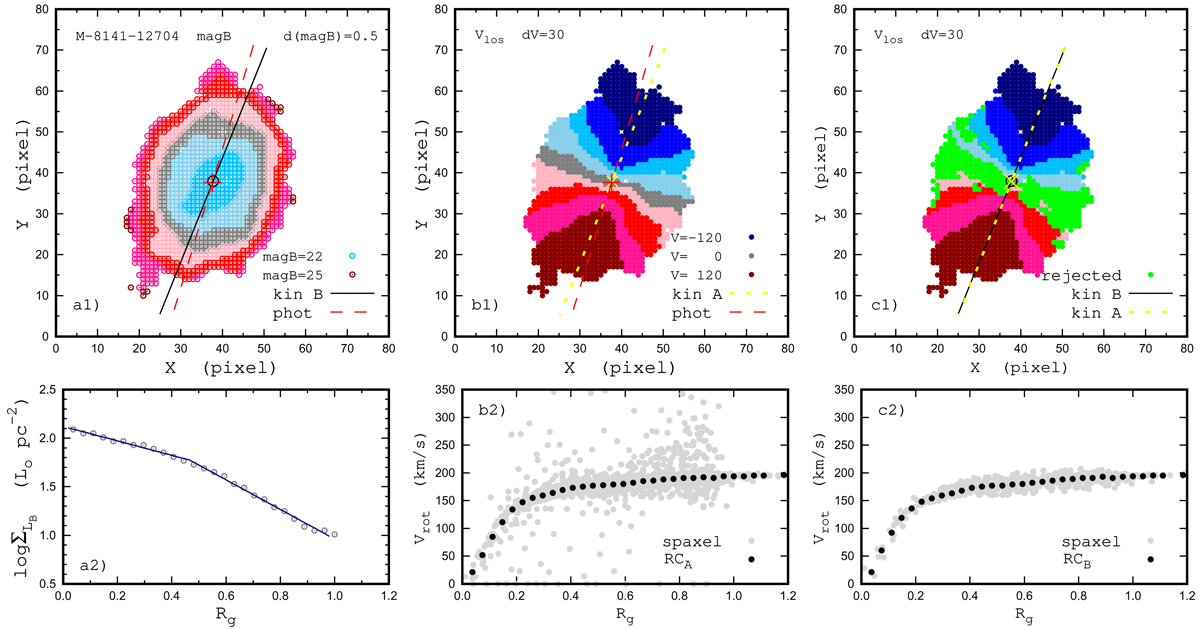
Panel a1: surface brightness distribution across the image of the galaxy M-8141-12704 in sky coordinates (pixels). The value of the surface brightness is colour-coded with a stepsize of d(magB) = 0.5. The plus sign indicates our derived photometric centre of the galaxy. The dashed line is the major photometric axis of the galaxy. The circle denotes the inferred kinematic centre of the galaxy. The solid line indicates the major kinematic axis of the galaxy for the case B. Panel a2: derived surface brightness profile (points, where the surface brightness is given in units of L⊙/pc2 as a function of the fractional optical radius Rg = R/R25) and the fit within the isophotal radius with a Sérsic profile for the bulge and a broken exponential for the disc (line). The surface brightness profile was obtained with kinematic (case B) geometric parameters of the galaxy. Panel b1: observed velocity field in pixel coordinates. The value of the observed velocity is colour-coded with a step size of 30 km s−1. The positions of the photometric centre and the major axis come from panel a1. The cross shows the kinematic centre of the galaxy. The dotted line shows the major kinematic axis of the galaxy for the case A. Panel b2: rotation curve derived for case A. The grey points stand for the obtained rotation velocities of the individual spaxels; the dark points are the mean values of the rotation velocities in rings of a width of 1 pixel. Panel c1: observed velocity field in pixel coordinates as in panel b1 but the spaxels rejected in the determination of the rotation curve for the case B are shown by the green colour. The circle indicates the kinematic centre of the galaxy, and the solid line is the major kinematic axis of the galaxy for case B. The cross is the kinematic centre and the dotted line is the major kinematic axis of the galaxy for the case A. Panel c2: rotation curve derived for case B. The grey points are the measured rotation velocities for individual spaxels; the dark points indicate the mean values of the rotation velocities in rings of a width of one pixel.
Current usage metrics show cumulative count of Article Views (full-text article views including HTML views, PDF and ePub downloads, according to the available data) and Abstracts Views on Vision4Press platform.
Data correspond to usage on the plateform after 2015. The current usage metrics is available 48-96 hours after online publication and is updated daily on week days.
Initial download of the metrics may take a while.