Fig. 27.
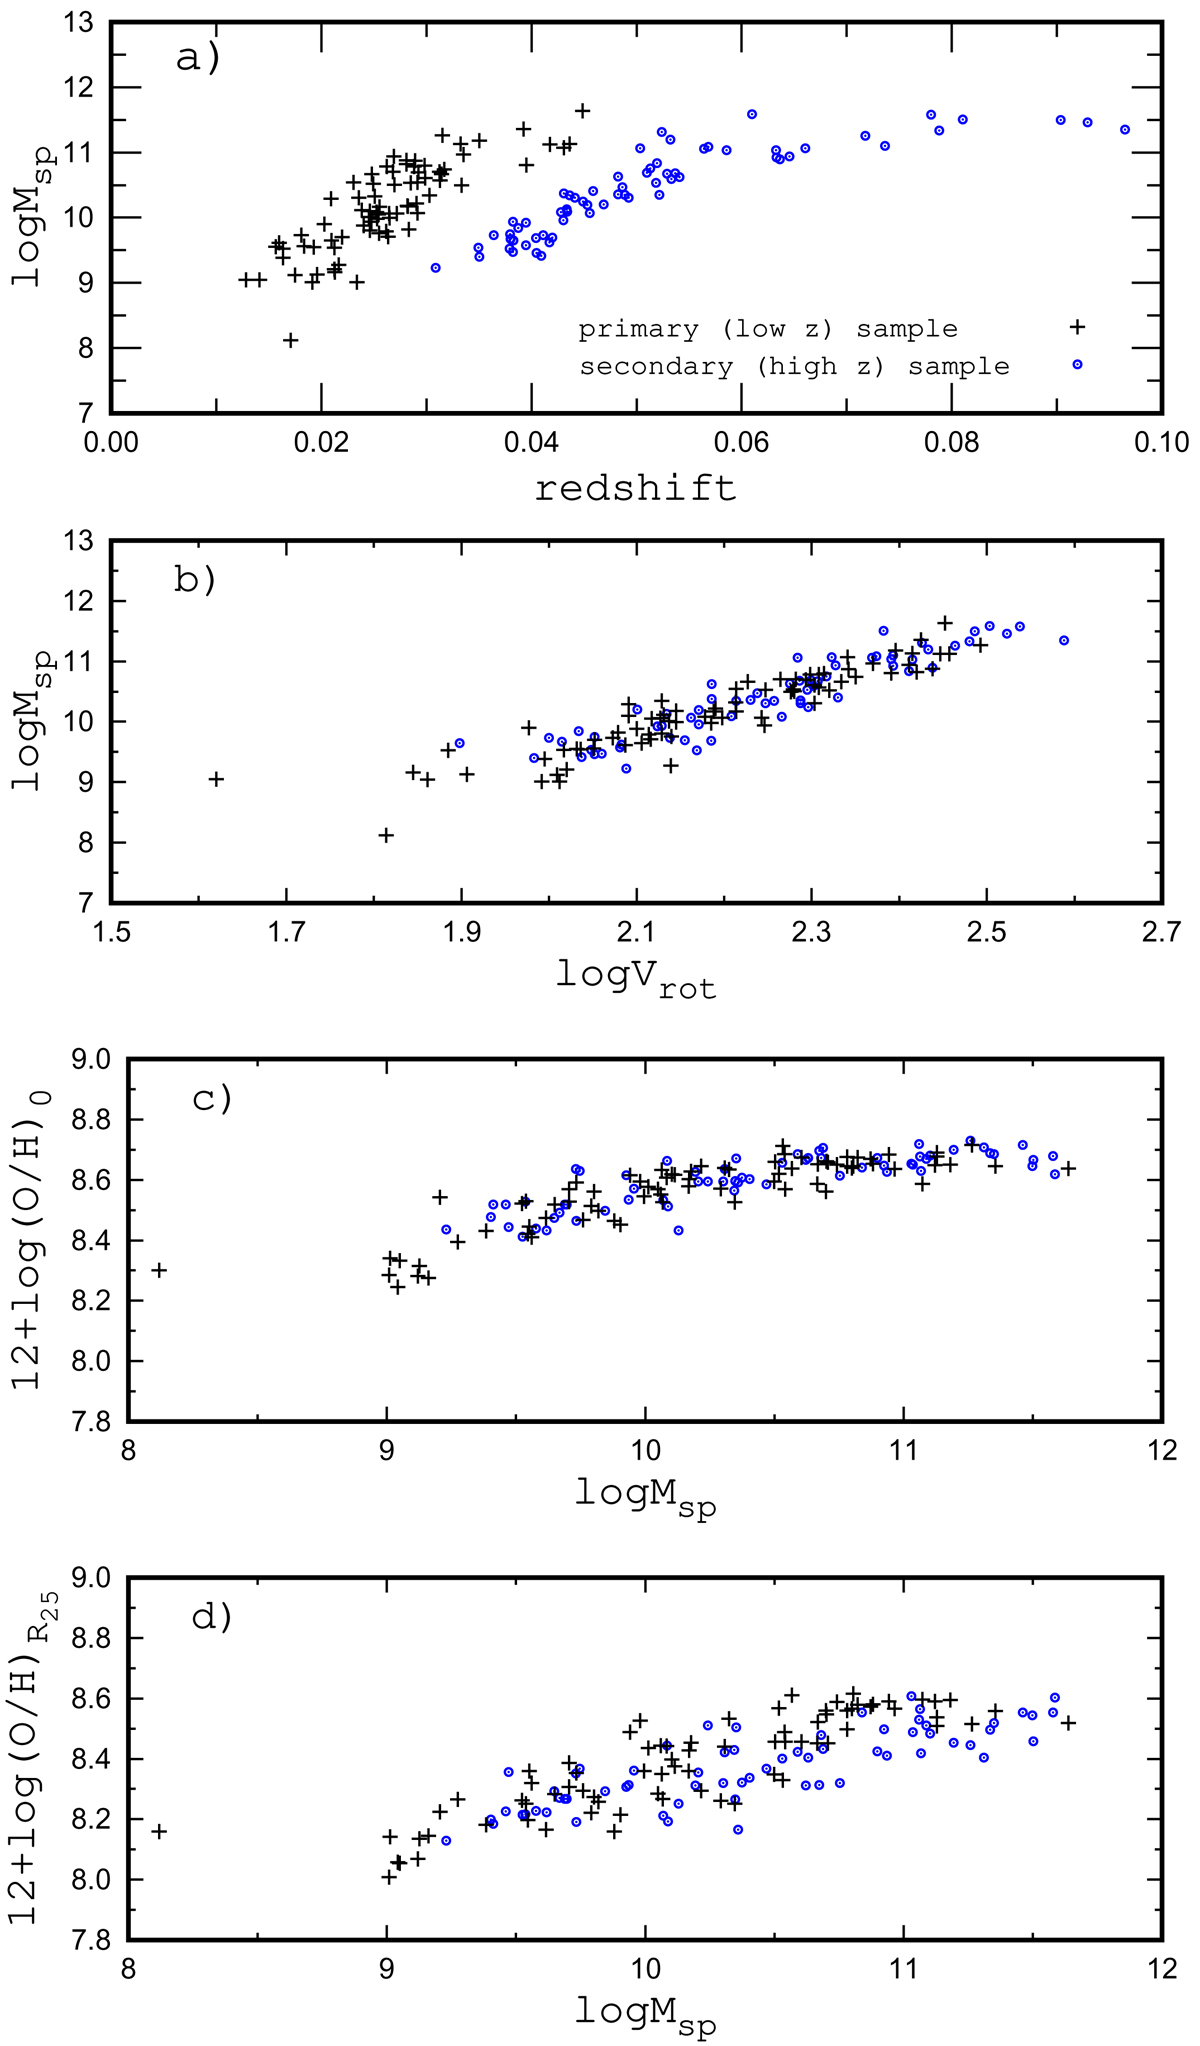
Panel a: stellar mass as a function of redshift for our galaxy sample. The galaxies of the primary (“low redshift”) and secondary (“high redshift”) sub-samples of the MaNGA targets (Bundy et al. 2015; Wake et al. 2017) are shown by different symbols. Panel b: stellar mass Tully–Fisher relation for those galaxies. Panels c and d: central oxygen abundance (panel c) and the oxygen abundance at the optical radius (panel d) as a function of stellar mass of the galaxy.
Current usage metrics show cumulative count of Article Views (full-text article views including HTML views, PDF and ePub downloads, according to the available data) and Abstracts Views on Vision4Press platform.
Data correspond to usage on the plateform after 2015. The current usage metrics is available 48-96 hours after online publication and is updated daily on week days.
Initial download of the metrics may take a while.