Fig. 24.
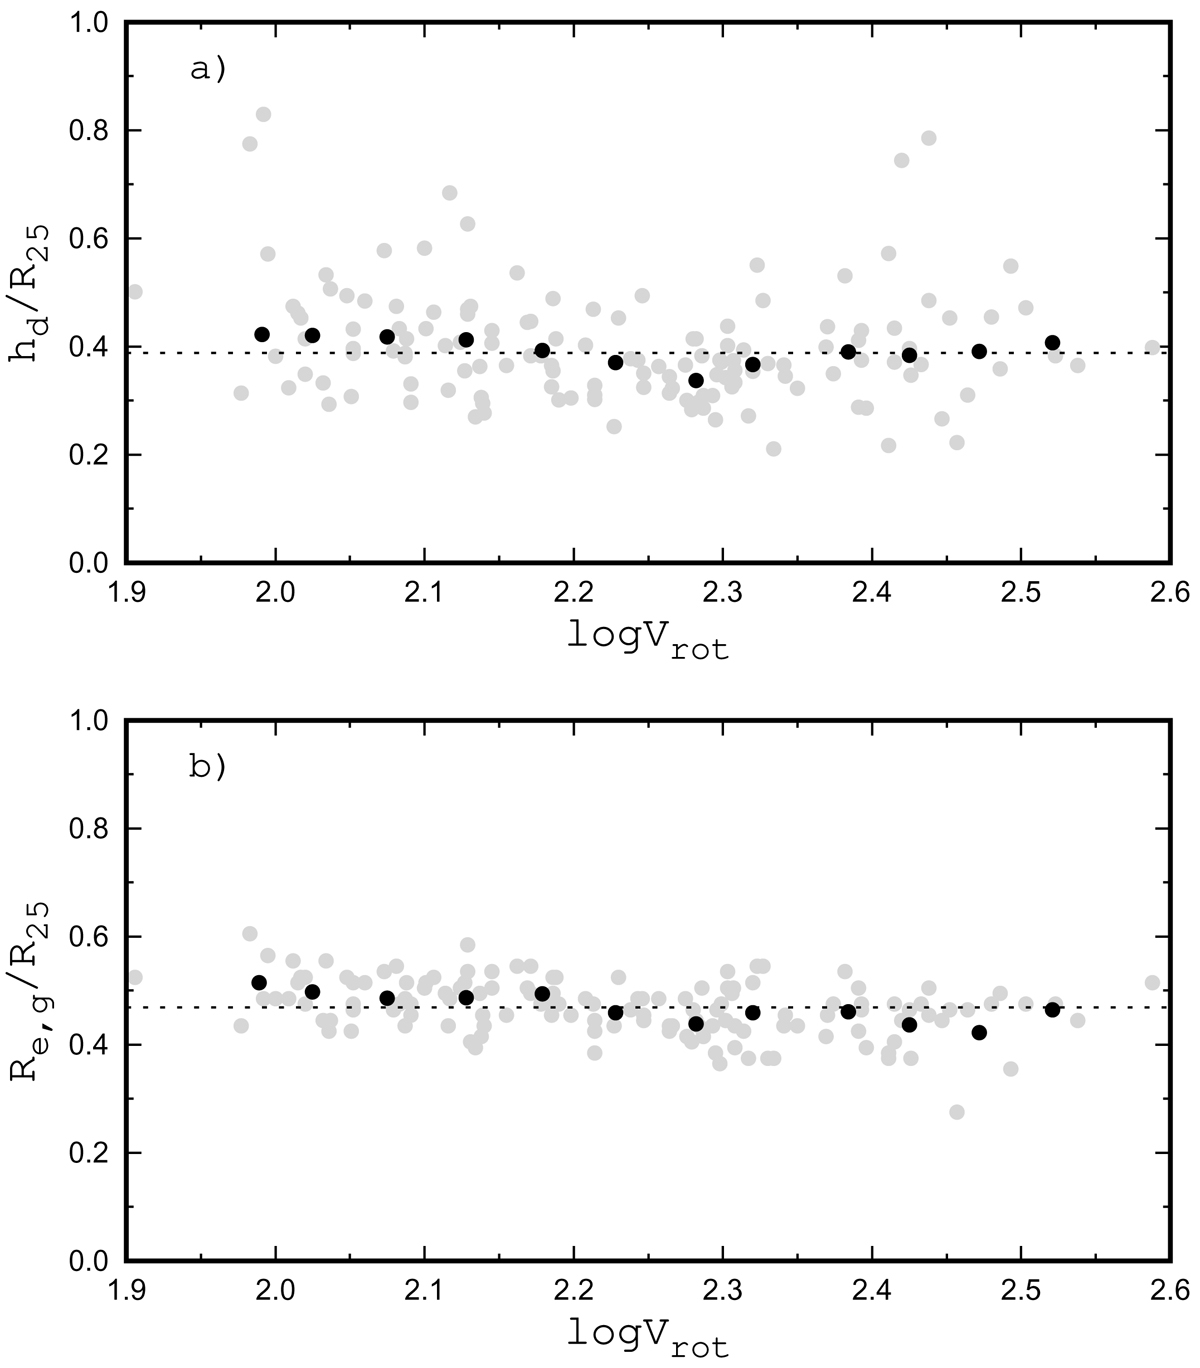
Panel a: ratio of the disc scale length to the optical radius hd/R25 as a function of the value of the rotation velocity Vrot. The grey points represent the data for individual MaNGA galaxies from our sample, and the dark points indicate the binned mean values (omitting objects with hd/R25 > 0.7). The dotted line is the mean hd/R25 value. Panel b: same as panel a but for the ratio of the effective radius of the galaxy to the optical radius Re, g/R25.
Current usage metrics show cumulative count of Article Views (full-text article views including HTML views, PDF and ePub downloads, according to the available data) and Abstracts Views on Vision4Press platform.
Data correspond to usage on the plateform after 2015. The current usage metrics is available 48-96 hours after online publication and is updated daily on week days.
Initial download of the metrics may take a while.