Fig. 21.
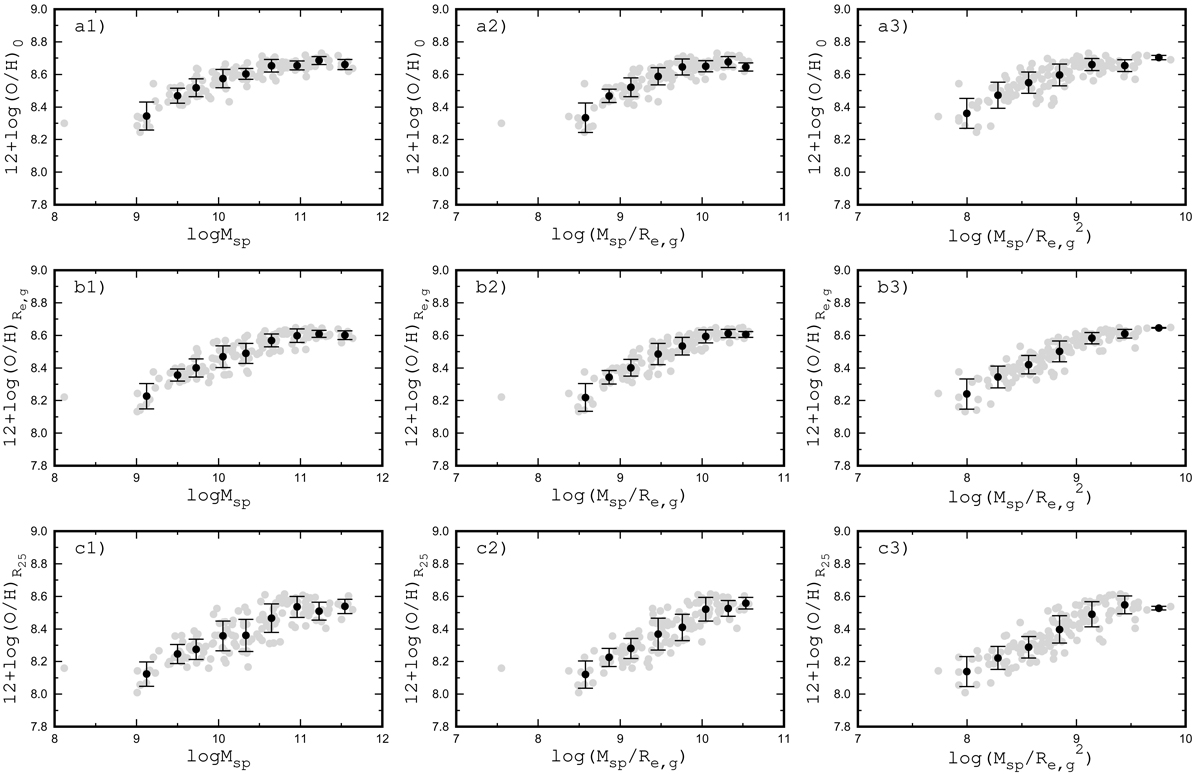
Central oxygen abundance (row a panels), the abundance at the galaxy effective radius (row b panels), and at the optical radius (row c panels) as a function of the stellar mass Msp (left column panels), as a function of Msp/Re, g (middle column panels), and as a function of ![]() (right column panels). The grey points in each panel represent the data for individual MaNGA galaxes from our sample, while the dark points are the binned mean values.
(right column panels). The grey points in each panel represent the data for individual MaNGA galaxes from our sample, while the dark points are the binned mean values.
Current usage metrics show cumulative count of Article Views (full-text article views including HTML views, PDF and ePub downloads, according to the available data) and Abstracts Views on Vision4Press platform.
Data correspond to usage on the plateform after 2015. The current usage metrics is available 48-96 hours after online publication and is updated daily on week days.
Initial download of the metrics may take a while.