Fig. 2.
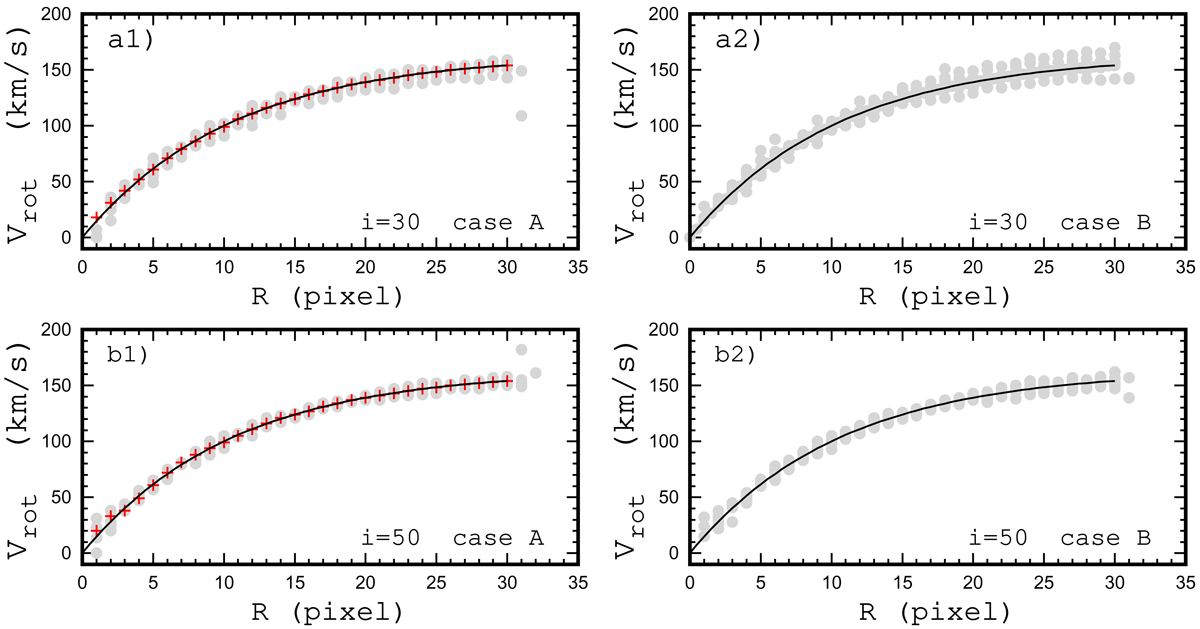
Panel a1: rotation curves for the model of a galaxy with an inclination angle i = 30° obtained for the case A. The solid line is the model rotation curve. The rotation curve derived from the modelled map of the line-of-sight velocities without errors is shown by plus signs. Six rotation curves derived from the modelled maps of the line-of-sight velocities with random errors are indicated by points. Panel a2: same as panel a1 but for the case B. Panels b1 and b2: same as panels a1 and a2 but for an inclination angle of i = 50°.
Current usage metrics show cumulative count of Article Views (full-text article views including HTML views, PDF and ePub downloads, according to the available data) and Abstracts Views on Vision4Press platform.
Data correspond to usage on the plateform after 2015. The current usage metrics is available 48-96 hours after online publication and is updated daily on week days.
Initial download of the metrics may take a while.