Fig. 18.
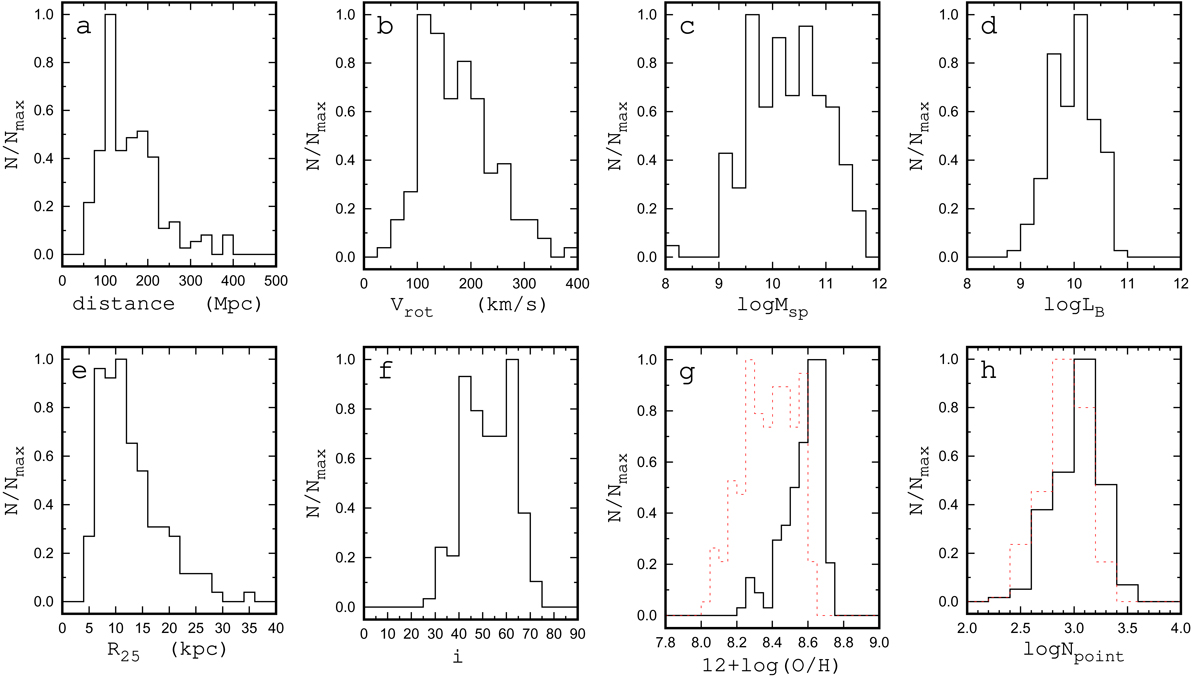
Properties of our sample of galaxies. The panels show the normalized histograms of the distances to our galaxies in Mpc (panel a), rotation velocities Vrot in km s−1 (panel b), spectroscopic stellar masses Msp in solar units (panel c), luminosities LB in solar units (panel d), optical radii R25 in kpc (panel e), inclination angles i in degrees (panel f), central (intersect) oxygen abundances 12 + log(O/H)0 (solid line) and oxygen abundances at the optical radii 12 + log(O/H)R25 (dashed line) (panel g), number of points in the velocity map (solid line), and number of points used in the determination of the final rotation curve (dashed line) (panel h).
Current usage metrics show cumulative count of Article Views (full-text article views including HTML views, PDF and ePub downloads, according to the available data) and Abstracts Views on Vision4Press platform.
Data correspond to usage on the plateform after 2015. The current usage metrics is available 48-96 hours after online publication and is updated daily on week days.
Initial download of the metrics may take a while.