Fig. 16.
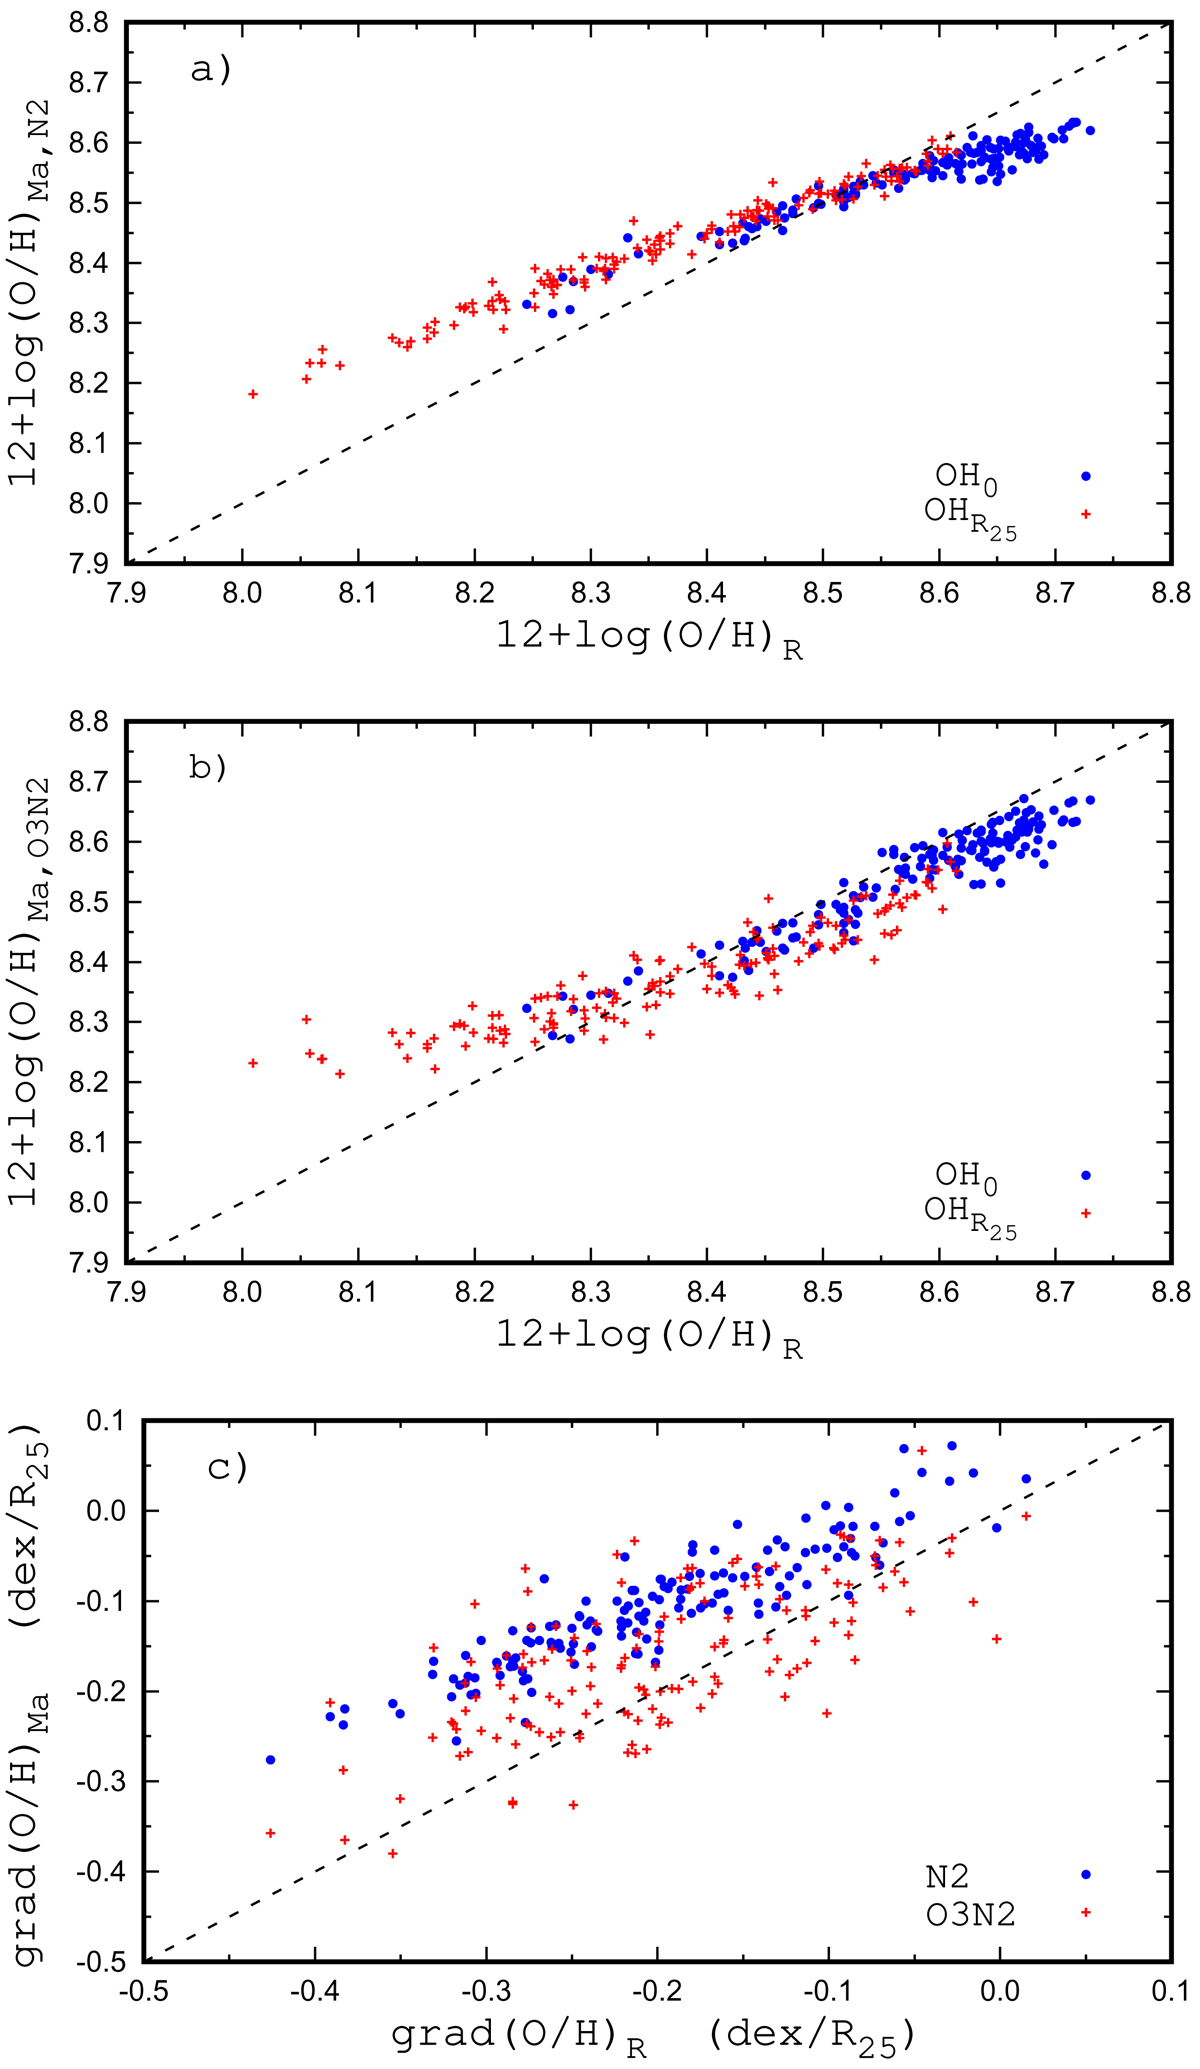
Panel a: comparison between central intersect oxygen abundances based on the abundances obtained through the R calibration of Pilyugin & Grebel (2016) and that based on the abundances obtained through the N2 calibration of Marino et al. (2013) (circles). The plus symbols show the comparison between intersect oxygen abundances at the optical radius R25. Circles in panel b: comparison between central intersect oxygen abundances based on the abundances obtained through the R calibration and that based on the abundances obtained through the O3N2 calibration of Marino et al. (2013). The plus symbols show the comparison between intersect oxygen abundances at the optical radius R25. Circles in panel c: abundance gradient for the N2-based abundances as a function of the abundance gradient for R-based abundances. The plus symbols show the abundance gradient for the O3N2-based abundances as a function of abundance gradient for R-based abundances. The dashed line in each panel indicates equal values.
Current usage metrics show cumulative count of Article Views (full-text article views including HTML views, PDF and ePub downloads, according to the available data) and Abstracts Views on Vision4Press platform.
Data correspond to usage on the plateform after 2015. The current usage metrics is available 48-96 hours after online publication and is updated daily on week days.
Initial download of the metrics may take a while.