Fig. 14.
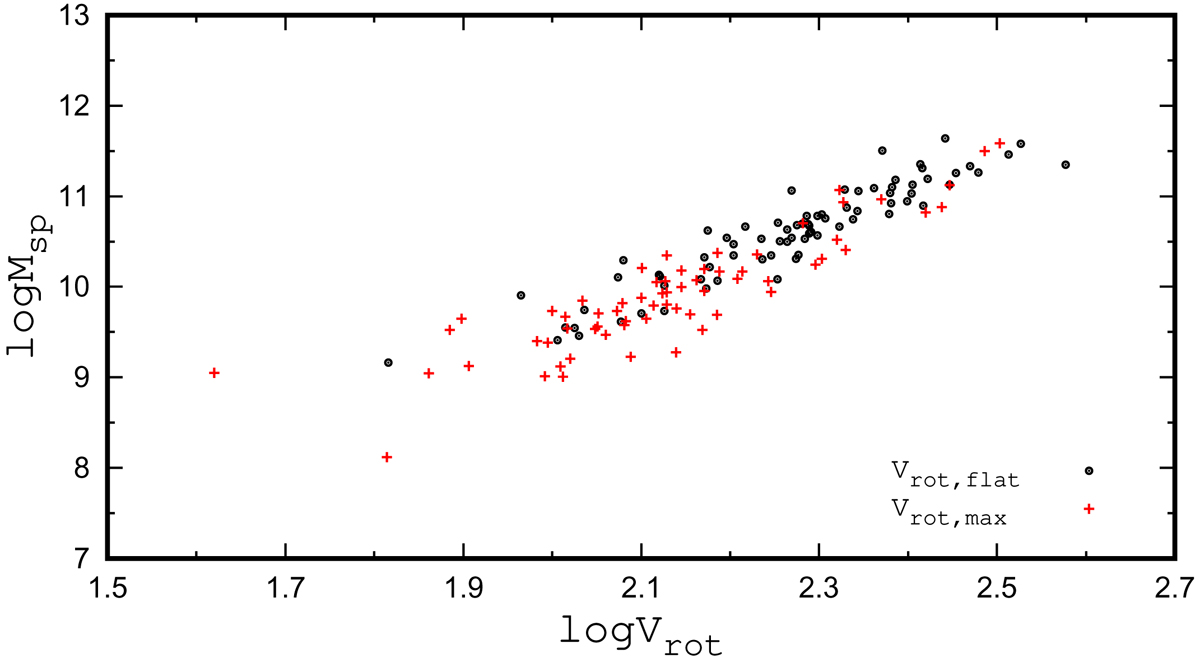
Spectroscopic stellar mass of our galaxies, Msp, as a function of rotation velocity, Vrot. The rotation velocity along the flat part of the rotation curve, Vflat, is shown for the galaxy if this value was obtained (circles). For the other galaxies, the maximum value of the rotation velocity within optical radius is plotted (plus signs).
Current usage metrics show cumulative count of Article Views (full-text article views including HTML views, PDF and ePub downloads, according to the available data) and Abstracts Views on Vision4Press platform.
Data correspond to usage on the plateform after 2015. The current usage metrics is available 48-96 hours after online publication and is updated daily on week days.
Initial download of the metrics may take a while.