Fig. 12.
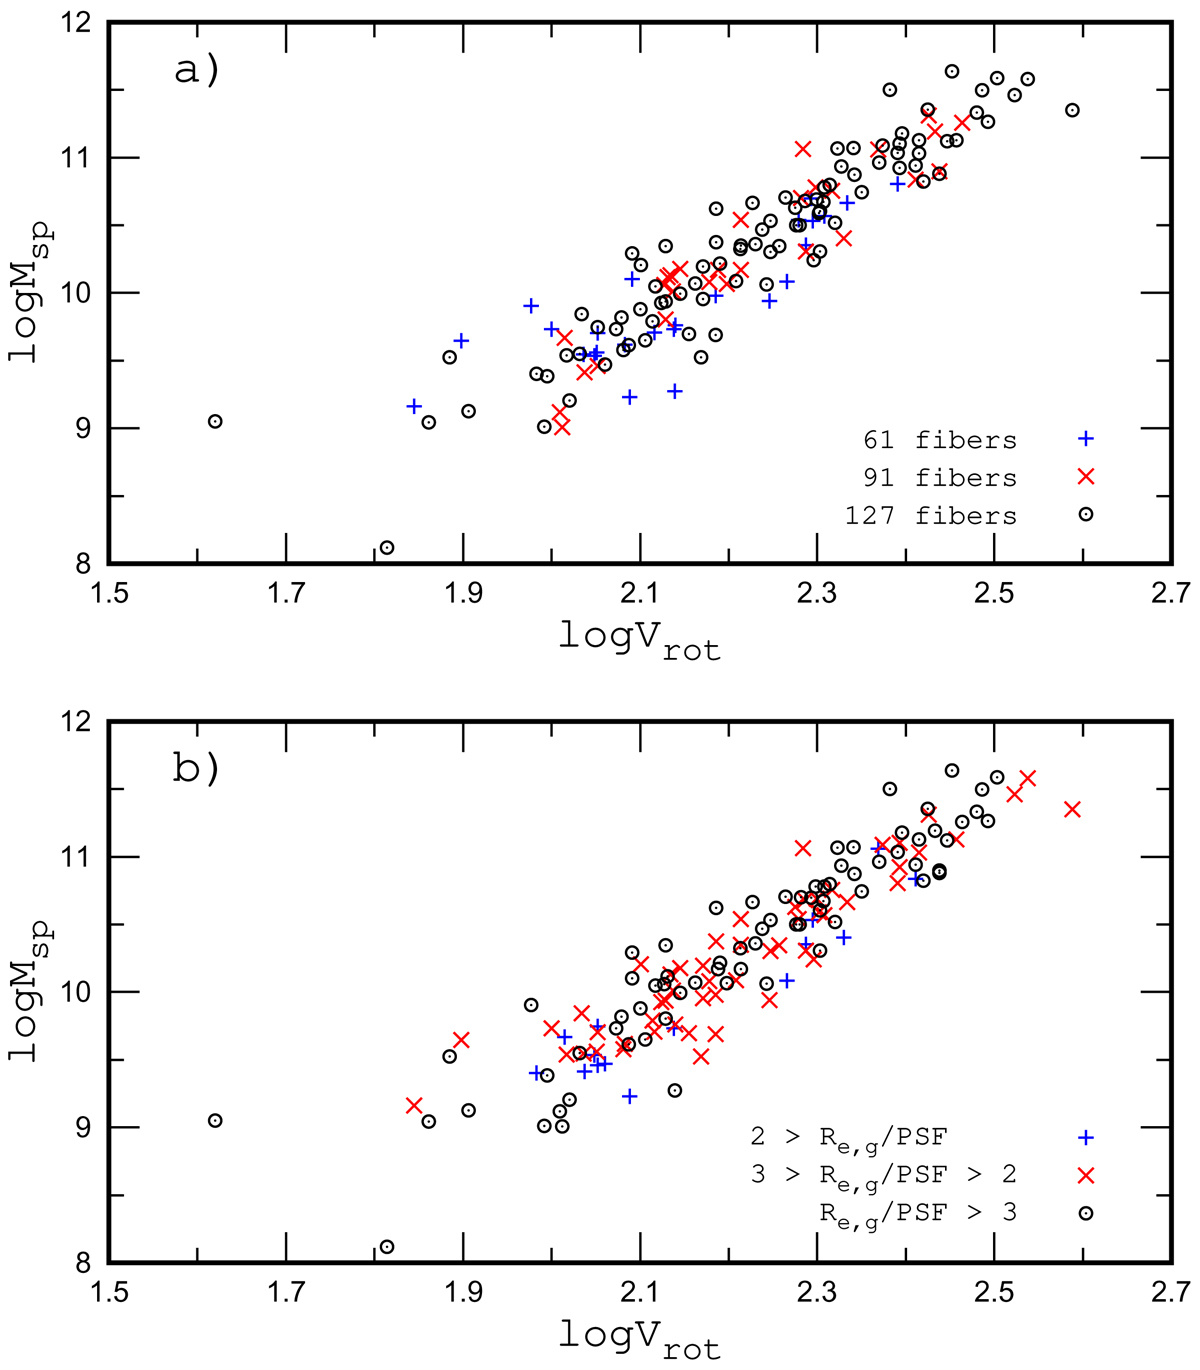
Panel a: stellar mass Tully–Fisher relation for our sample of MaNGA galaxies. Galaxies measured with different numbers of fibres are indicated by different symbols. Panel b: same as panel a but the galaxies with different Re, g/PSF (the ratio of the effective radius of the galaxy to the full width at half maximum of the point spread function) are indicated by different symbols.
Current usage metrics show cumulative count of Article Views (full-text article views including HTML views, PDF and ePub downloads, according to the available data) and Abstracts Views on Vision4Press platform.
Data correspond to usage on the plateform after 2015. The current usage metrics is available 48-96 hours after online publication and is updated daily on week days.
Initial download of the metrics may take a while.