Fig. 10.
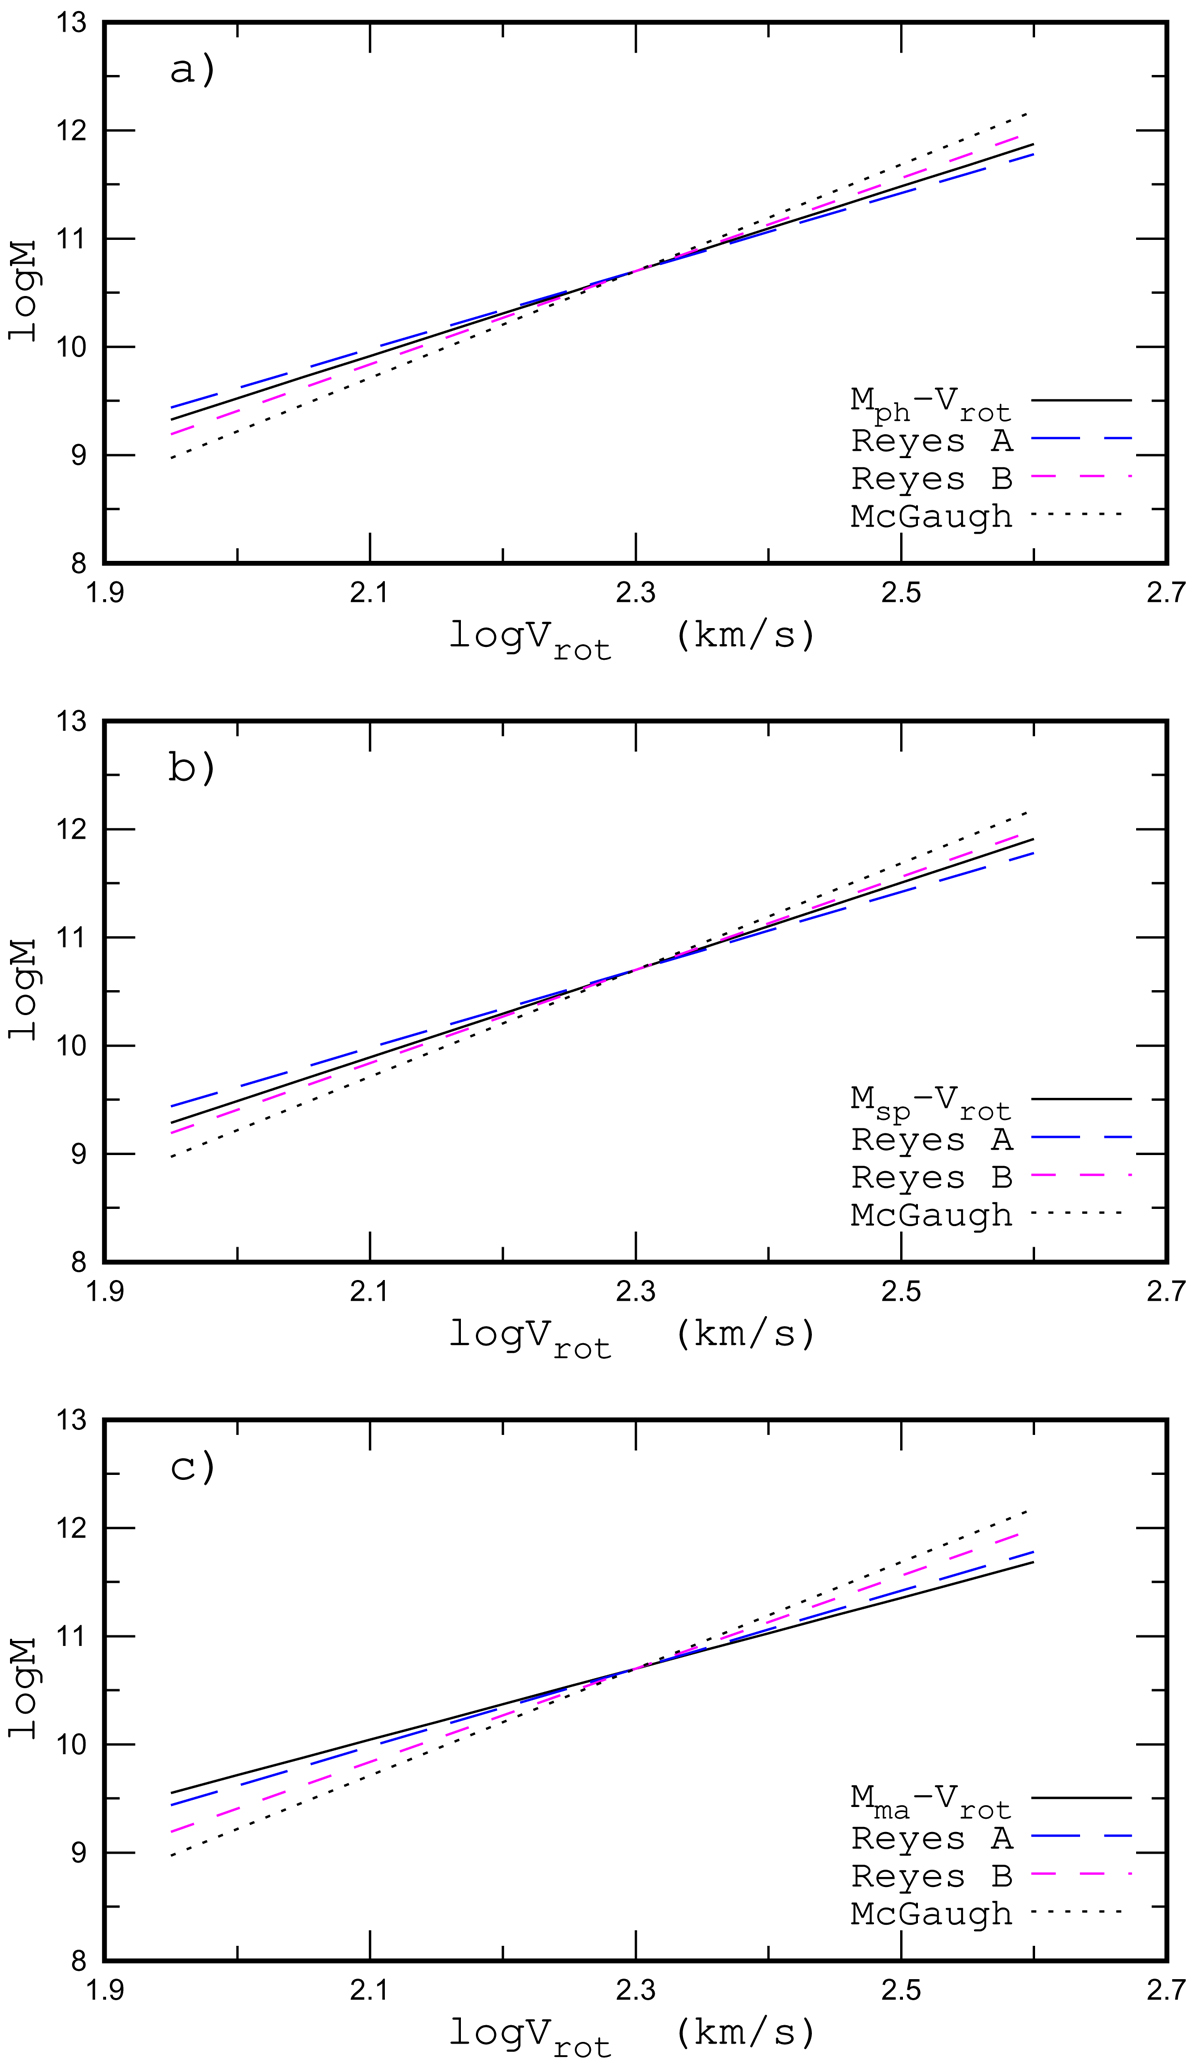
Panel a: comparison of our Mph–Vrot relation with the stellar mass Tully–Fisher relation from McGaugh & Schombert (2015) and two relations (for two kinds of stellar mass estimates) from Reyes et al. (2011). The meaning of each line is described in the legend. Each relation is shifted along the M-axis in such a way that the log M = 10.7 at log Vrot = 2.3. Panels b and c: same as panel a but for the Msp–Vrot and Mma–Vrot relations, respectively.
Current usage metrics show cumulative count of Article Views (full-text article views including HTML views, PDF and ePub downloads, according to the available data) and Abstracts Views on Vision4Press platform.
Data correspond to usage on the plateform after 2015. The current usage metrics is available 48-96 hours after online publication and is updated daily on week days.
Initial download of the metrics may take a while.