Fig. B.1.
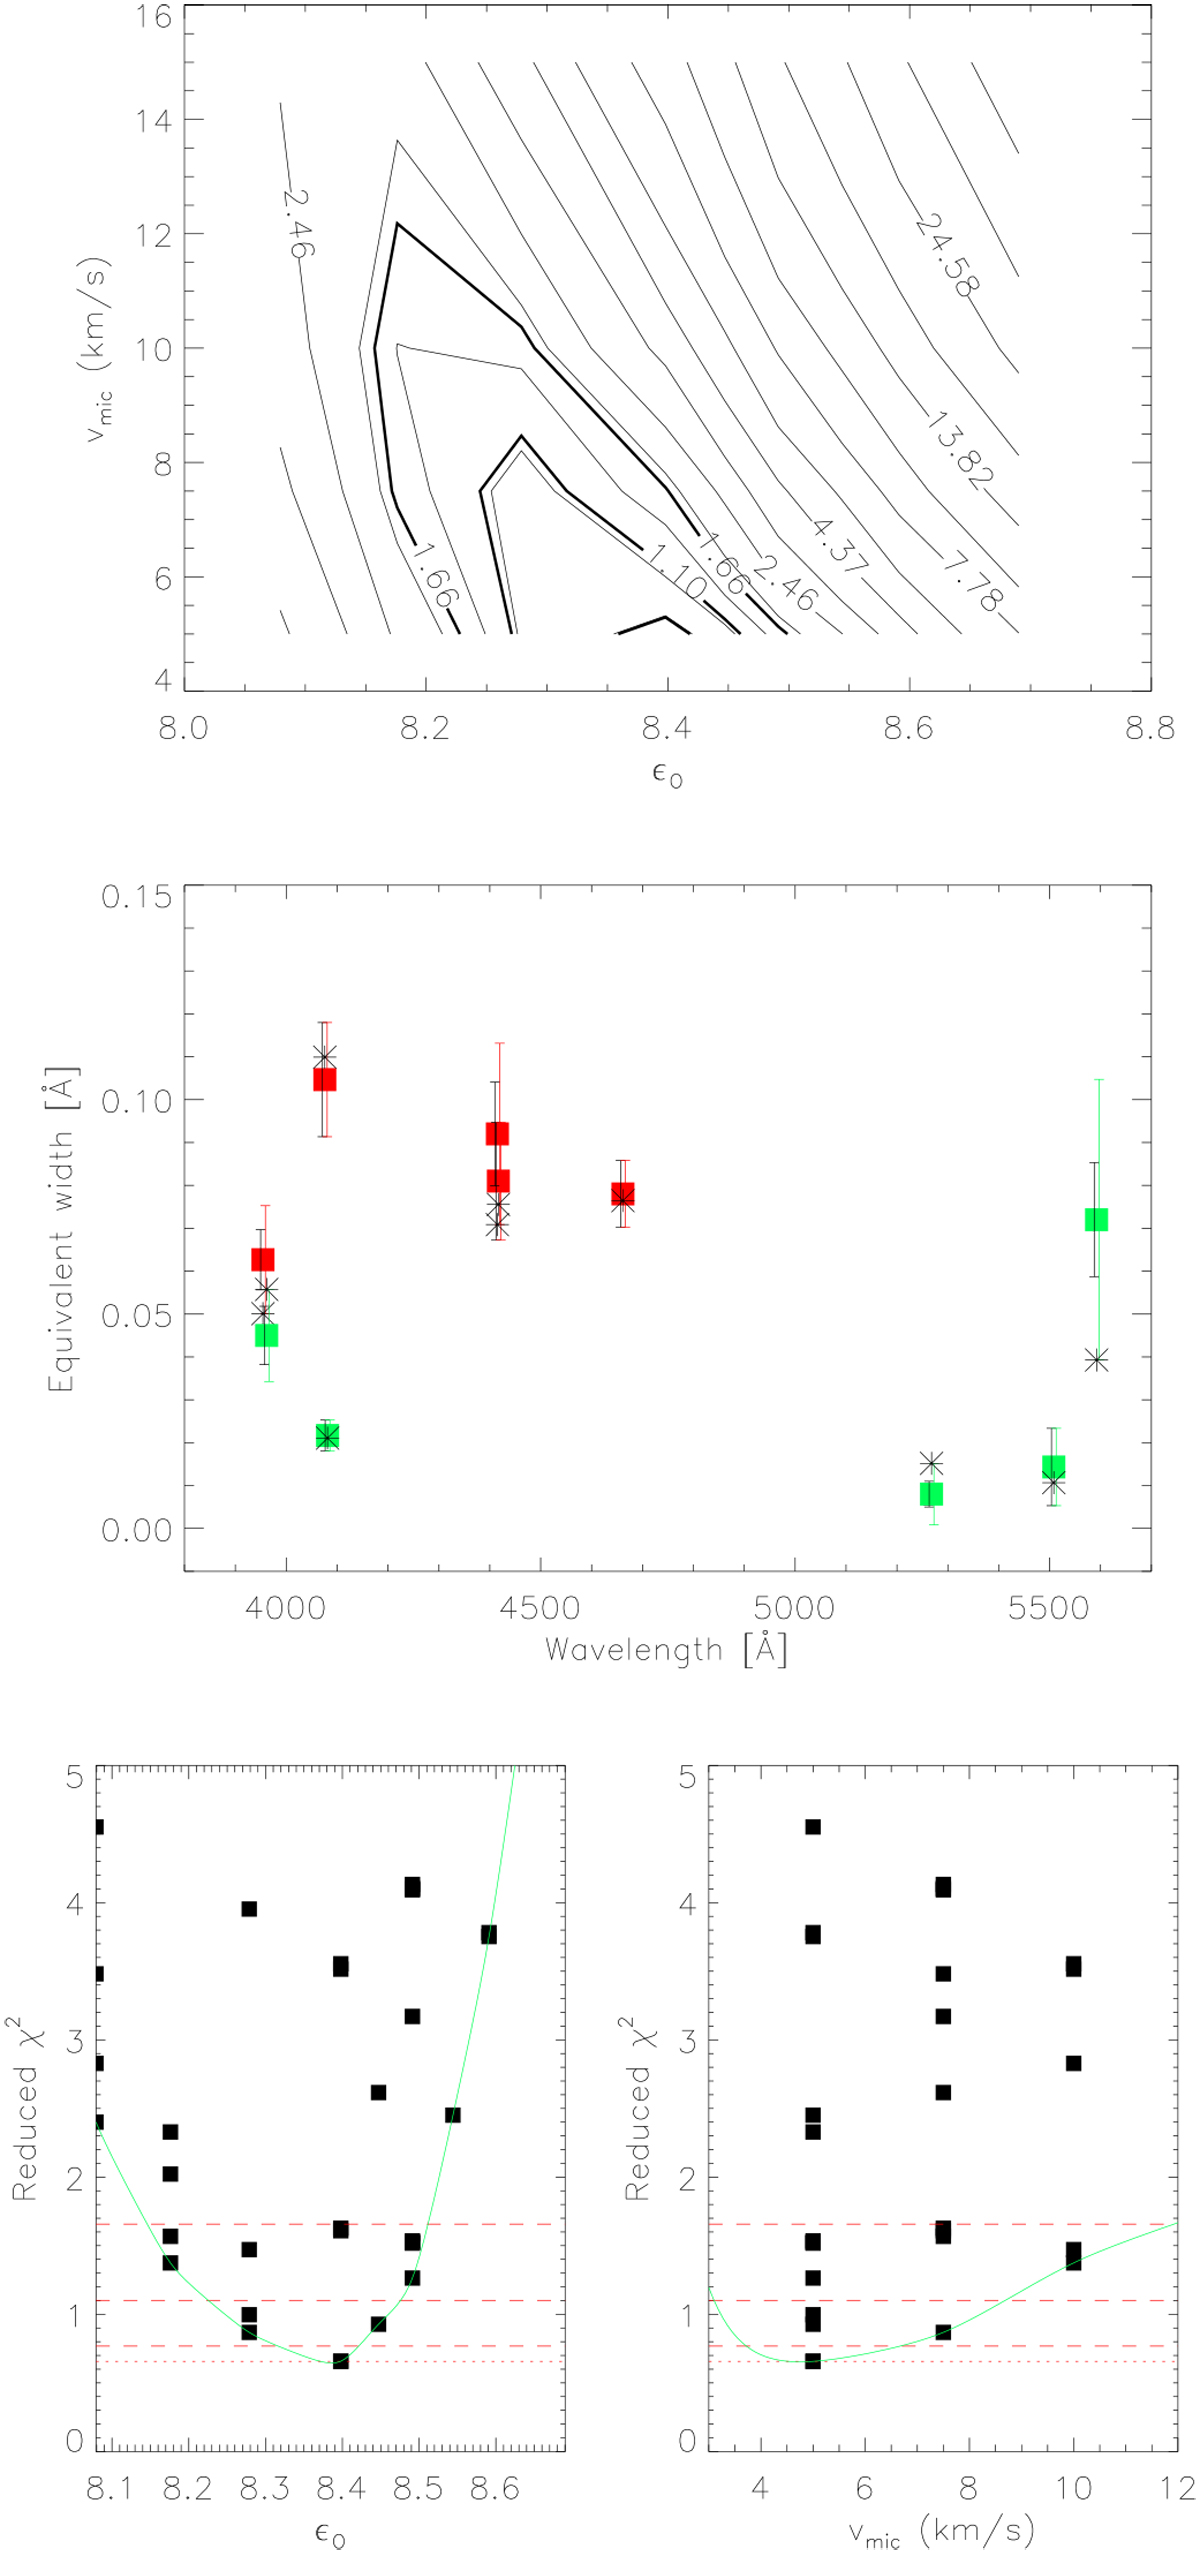
Oxygen analysis for HD 36512 (O9.7 V) (#1). Upper panel: ![]() iso-contours in the ϵO–vmic plane. Middle panel: compares the observed and theoretical equivalent widths including error bars (see text), and visualizes the quality of the best-fitting model. In this case, major discrepancies are only found for O III 5592, which indicates a larger value of ϵO. Lower panels: χ2 distribution projected onto the ϵO (left panel) and the vmic (right panel) axis (see text).
iso-contours in the ϵO–vmic plane. Middle panel: compares the observed and theoretical equivalent widths including error bars (see text), and visualizes the quality of the best-fitting model. In this case, major discrepancies are only found for O III 5592, which indicates a larger value of ϵO. Lower panels: χ2 distribution projected onto the ϵO (left panel) and the vmic (right panel) axis (see text).
Current usage metrics show cumulative count of Article Views (full-text article views including HTML views, PDF and ePub downloads, according to the available data) and Abstracts Views on Vision4Press platform.
Data correspond to usage on the plateform after 2015. The current usage metrics is available 48-96 hours after online publication and is updated daily on week days.
Initial download of the metrics may take a while.