Fig. 6.
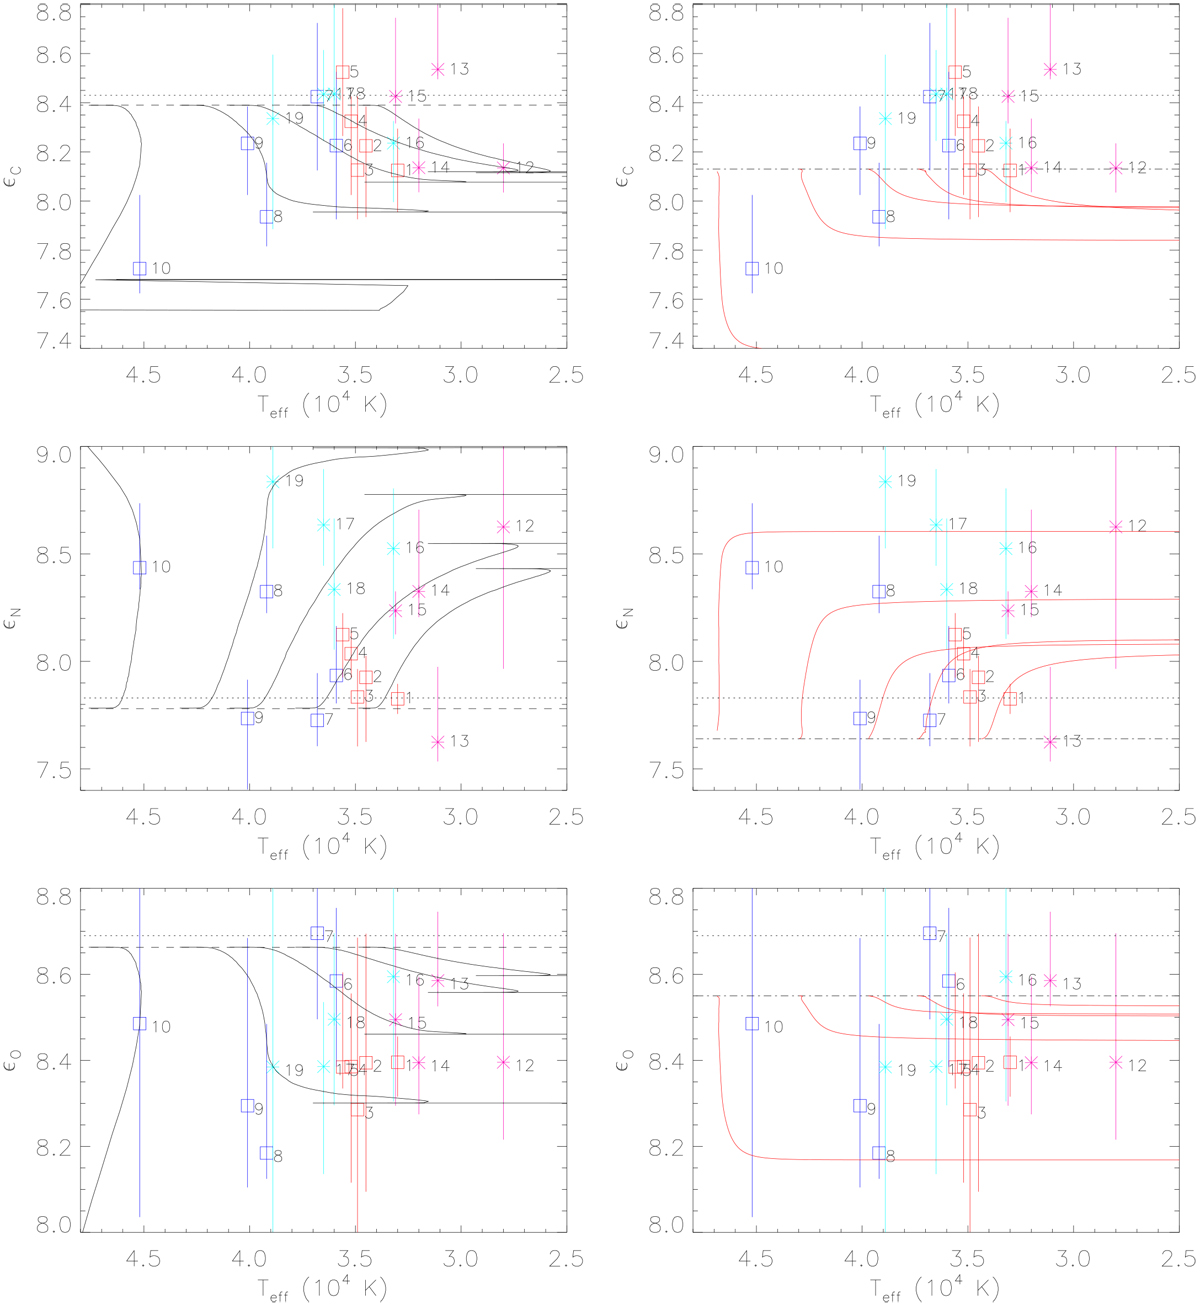
Evolution of C/N/O abundances for different masses (from left to right panels: 60, 40, ~30, 25, and 20 M⊙) as a functionof Teff, as predicted by the rotating Geneva (black lines, left panels) and Bonn tracks (red lines, right panels). The dotted line represents the solar abundance. The dashed and the dash-dotted lines display the initial abundances used in the Geneva andin the Bonn calculations, respectively. Our results (symbols as in Fig. 1) are shown with errors accounting for typical uncertainties in stellar parameters. For initial evolutionary masses of sample stars, see Table 5.
Current usage metrics show cumulative count of Article Views (full-text article views including HTML views, PDF and ePub downloads, according to the available data) and Abstracts Views on Vision4Press platform.
Data correspond to usage on the plateform after 2015. The current usage metrics is available 48-96 hours after online publication and is updated daily on week days.
Initial download of the metrics may take a while.