Fig. 5.
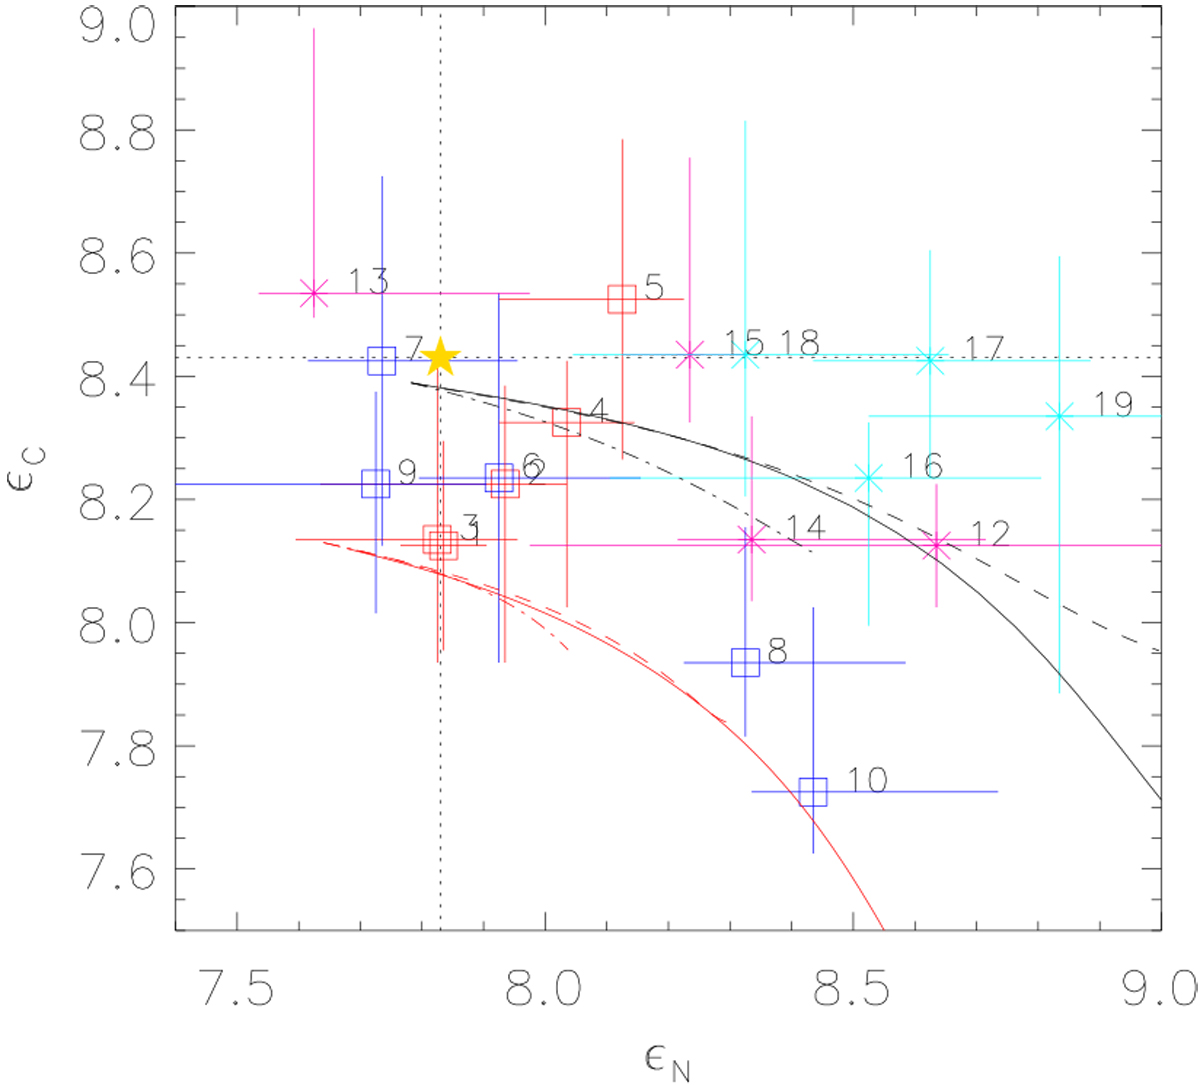
Relation ϵC vs. ϵN in the light of evolutionary tracks. The black and red lines display the corresponding Geneva and Bonn tracks with ![]() , respectively, where the solid lines refer to the 60 M⊙, the dashed lines to the 40 M⊙, and the dashed-dotted lines to the 20 M⊙ tracks. The dotted lines represent the solar C and N abundances, and their intersection the position of the sun in this diagram. Symbols as in Fig. 1. Error bars include typical uncertainties in the stellar parameters.
, respectively, where the solid lines refer to the 60 M⊙, the dashed lines to the 40 M⊙, and the dashed-dotted lines to the 20 M⊙ tracks. The dotted lines represent the solar C and N abundances, and their intersection the position of the sun in this diagram. Symbols as in Fig. 1. Error bars include typical uncertainties in the stellar parameters.
Current usage metrics show cumulative count of Article Views (full-text article views including HTML views, PDF and ePub downloads, according to the available data) and Abstracts Views on Vision4Press platform.
Data correspond to usage on the plateform after 2015. The current usage metrics is available 48-96 hours after online publication and is updated daily on week days.
Initial download of the metrics may take a while.