Fig. 3.
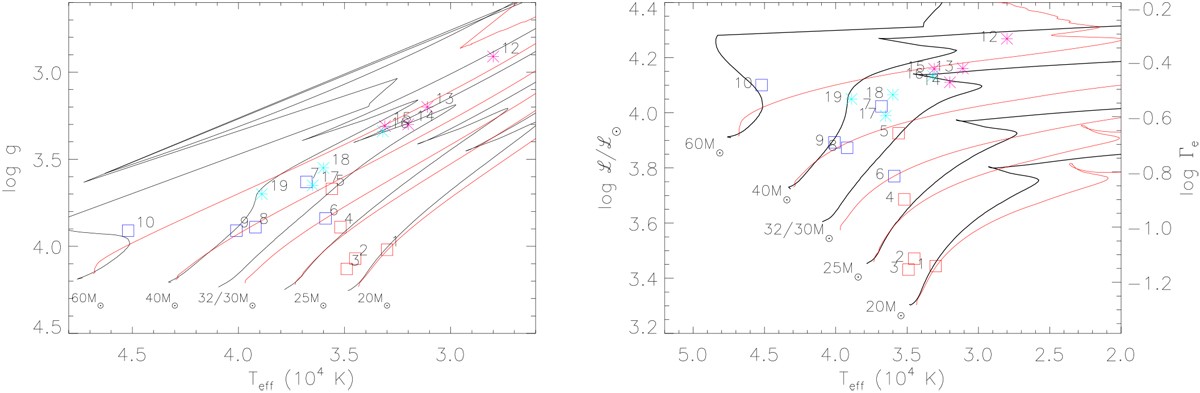
Left panel: Kiel diagram (log g vs. Teff) for our sample stars. Overplotted are the rotating Geneva (Ekström et al. 2012; black) and Bonn (Brott et al. 2011; red) tracks for the mass range 20–60 M⊙, with initial rotation velocities of 40% of their critical speed. Right panel: corresponding spectroscopy HR diagram (sHRD, see text), with both ordinate-axes proportional to L∕M. The Eddington Γe has been calculated with solar Helium content, assumed to be completely ionized. Symbols in both panels as in Fig. 1.
Current usage metrics show cumulative count of Article Views (full-text article views including HTML views, PDF and ePub downloads, according to the available data) and Abstracts Views on Vision4Press platform.
Data correspond to usage on the plateform after 2015. The current usage metrics is available 48-96 hours after online publication and is updated daily on week days.
Initial download of the metrics may take a while.